


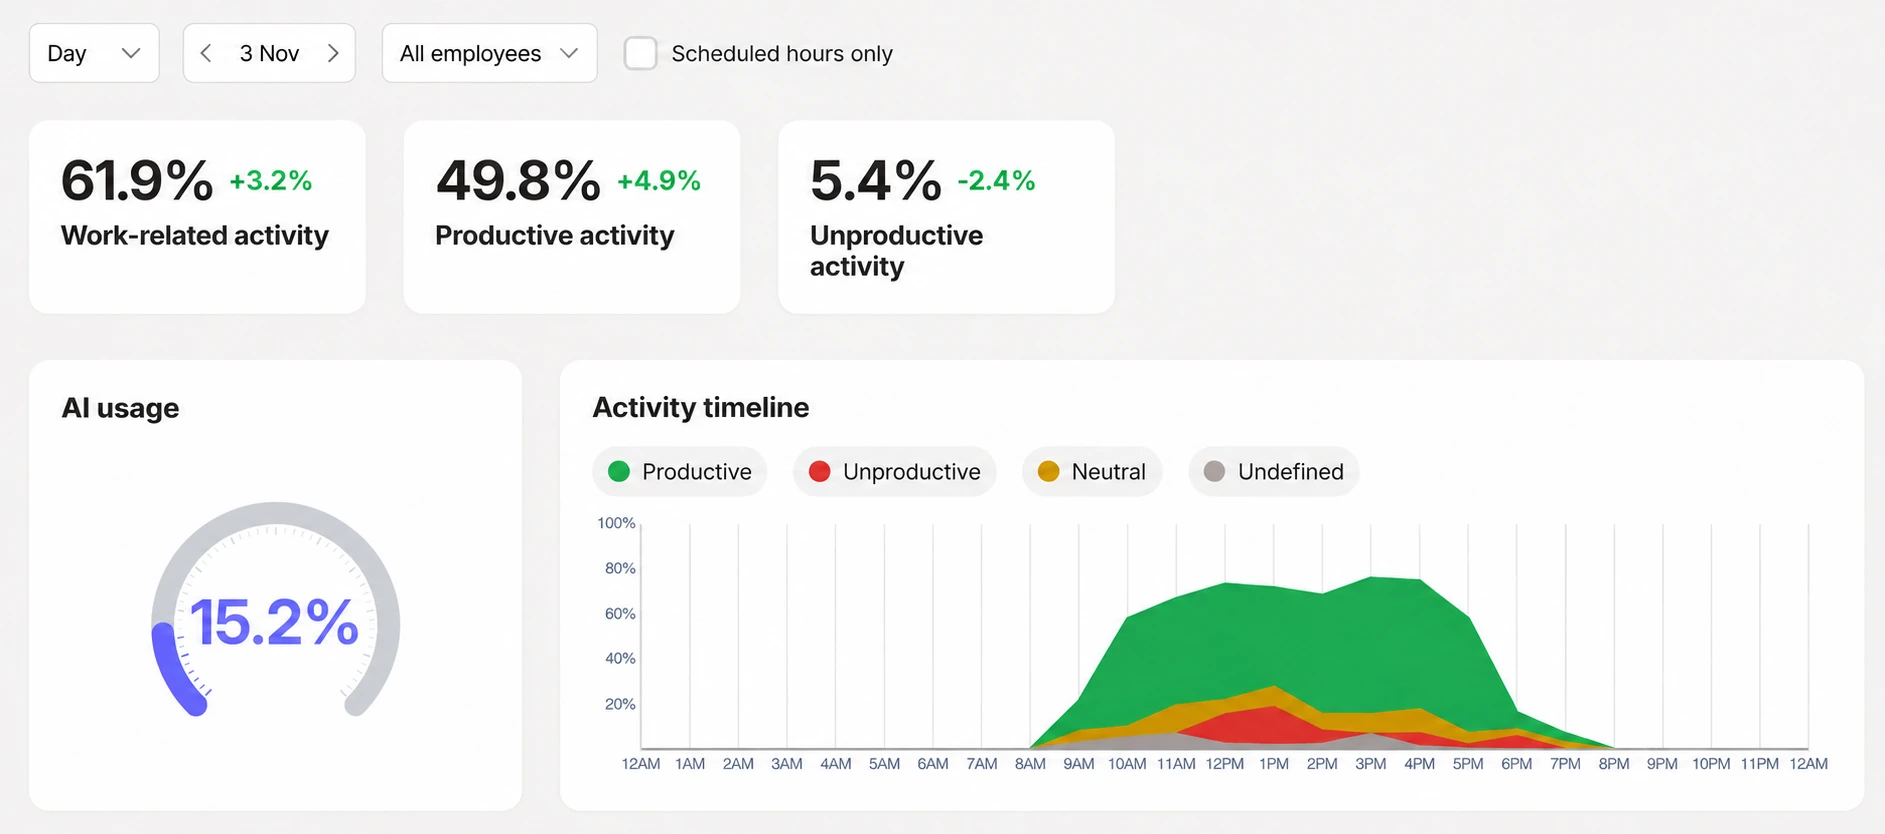
Key metrics, AI usage and activity timeline
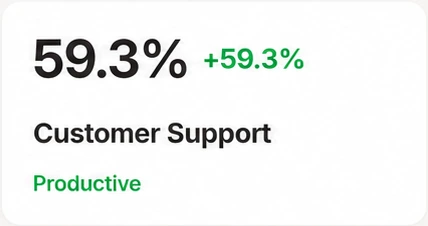
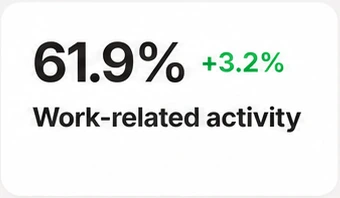
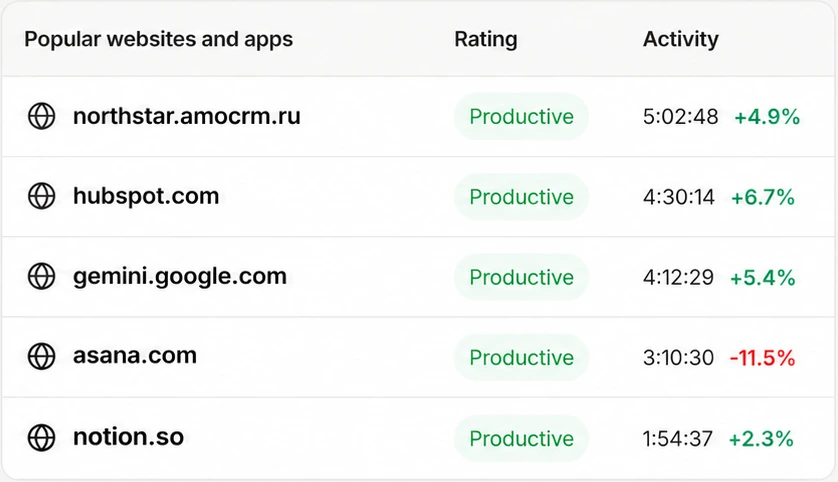
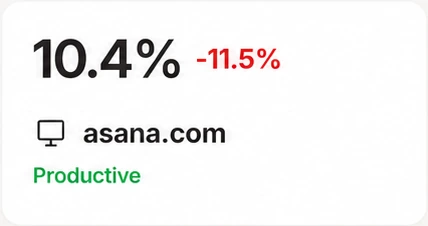
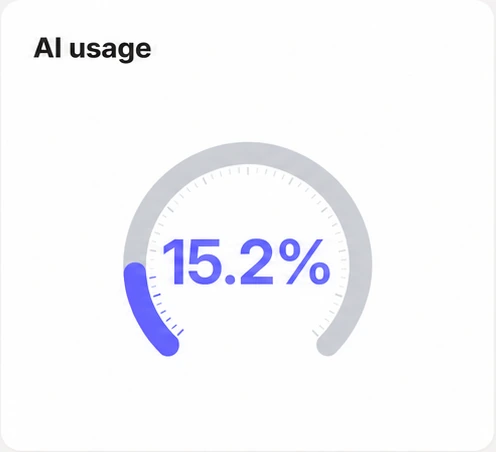
The top row shows work-related, productive and unproductive activity, late starts and early departures, each with its change from the previous period. Below are the AI usage gauge and an activity timeline coloured by productivity.
- Green and red deltas on every metric
- Share of time in AI tools
- Hover the timeline for exact numbers
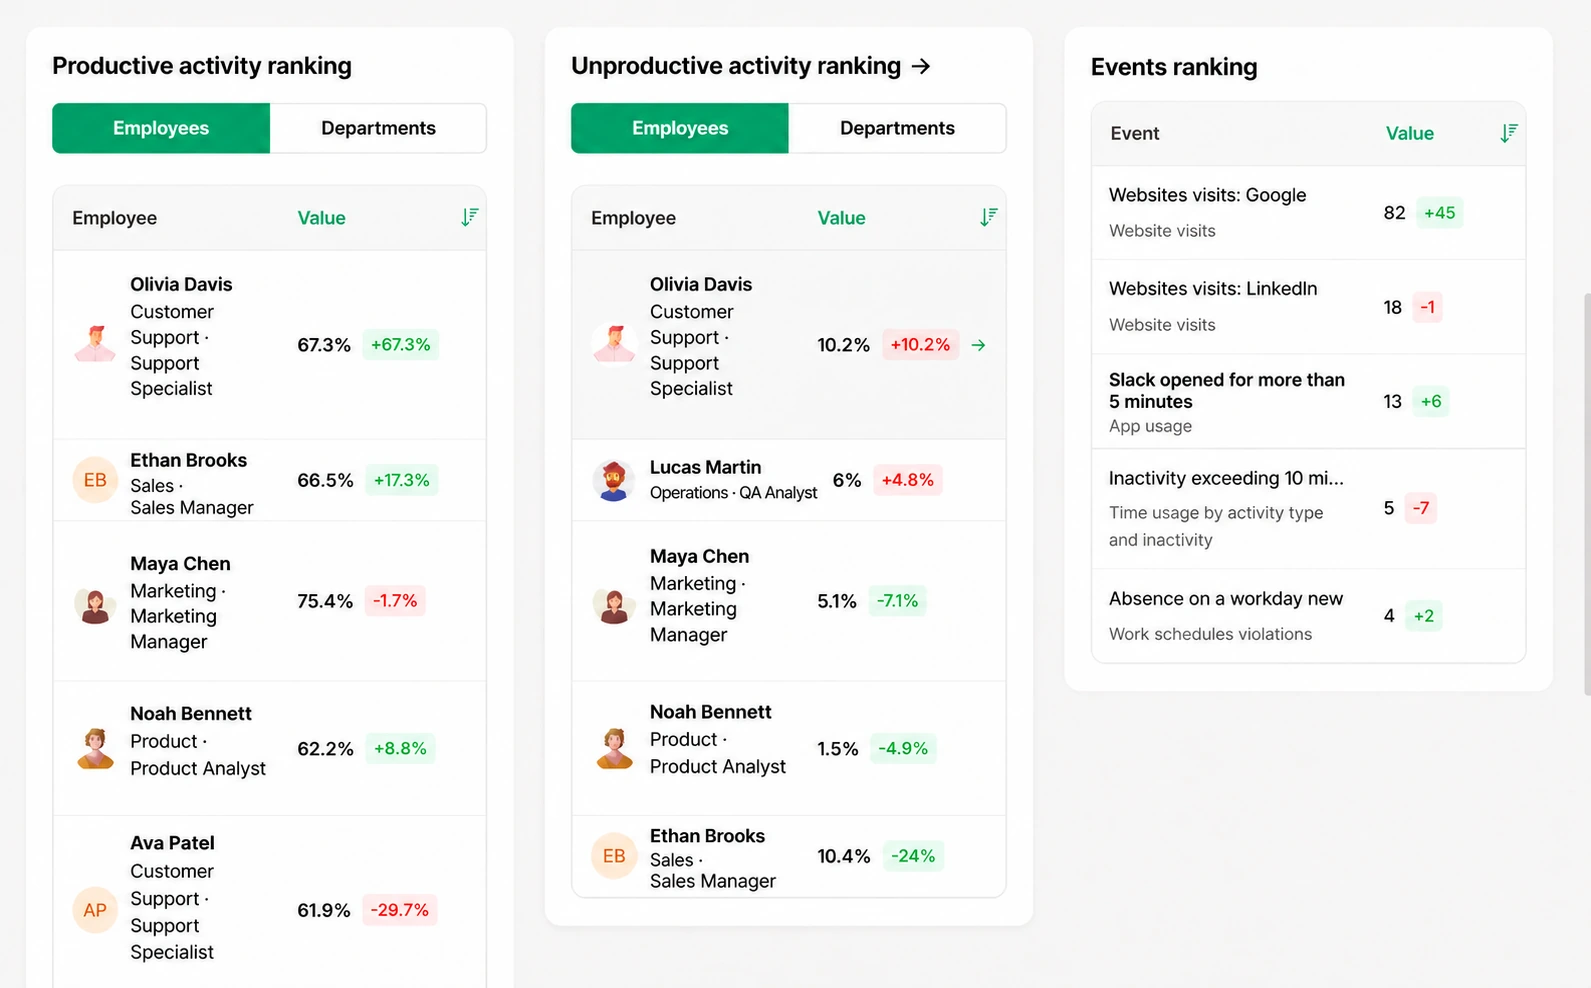









 Central Server web interface