Activity History
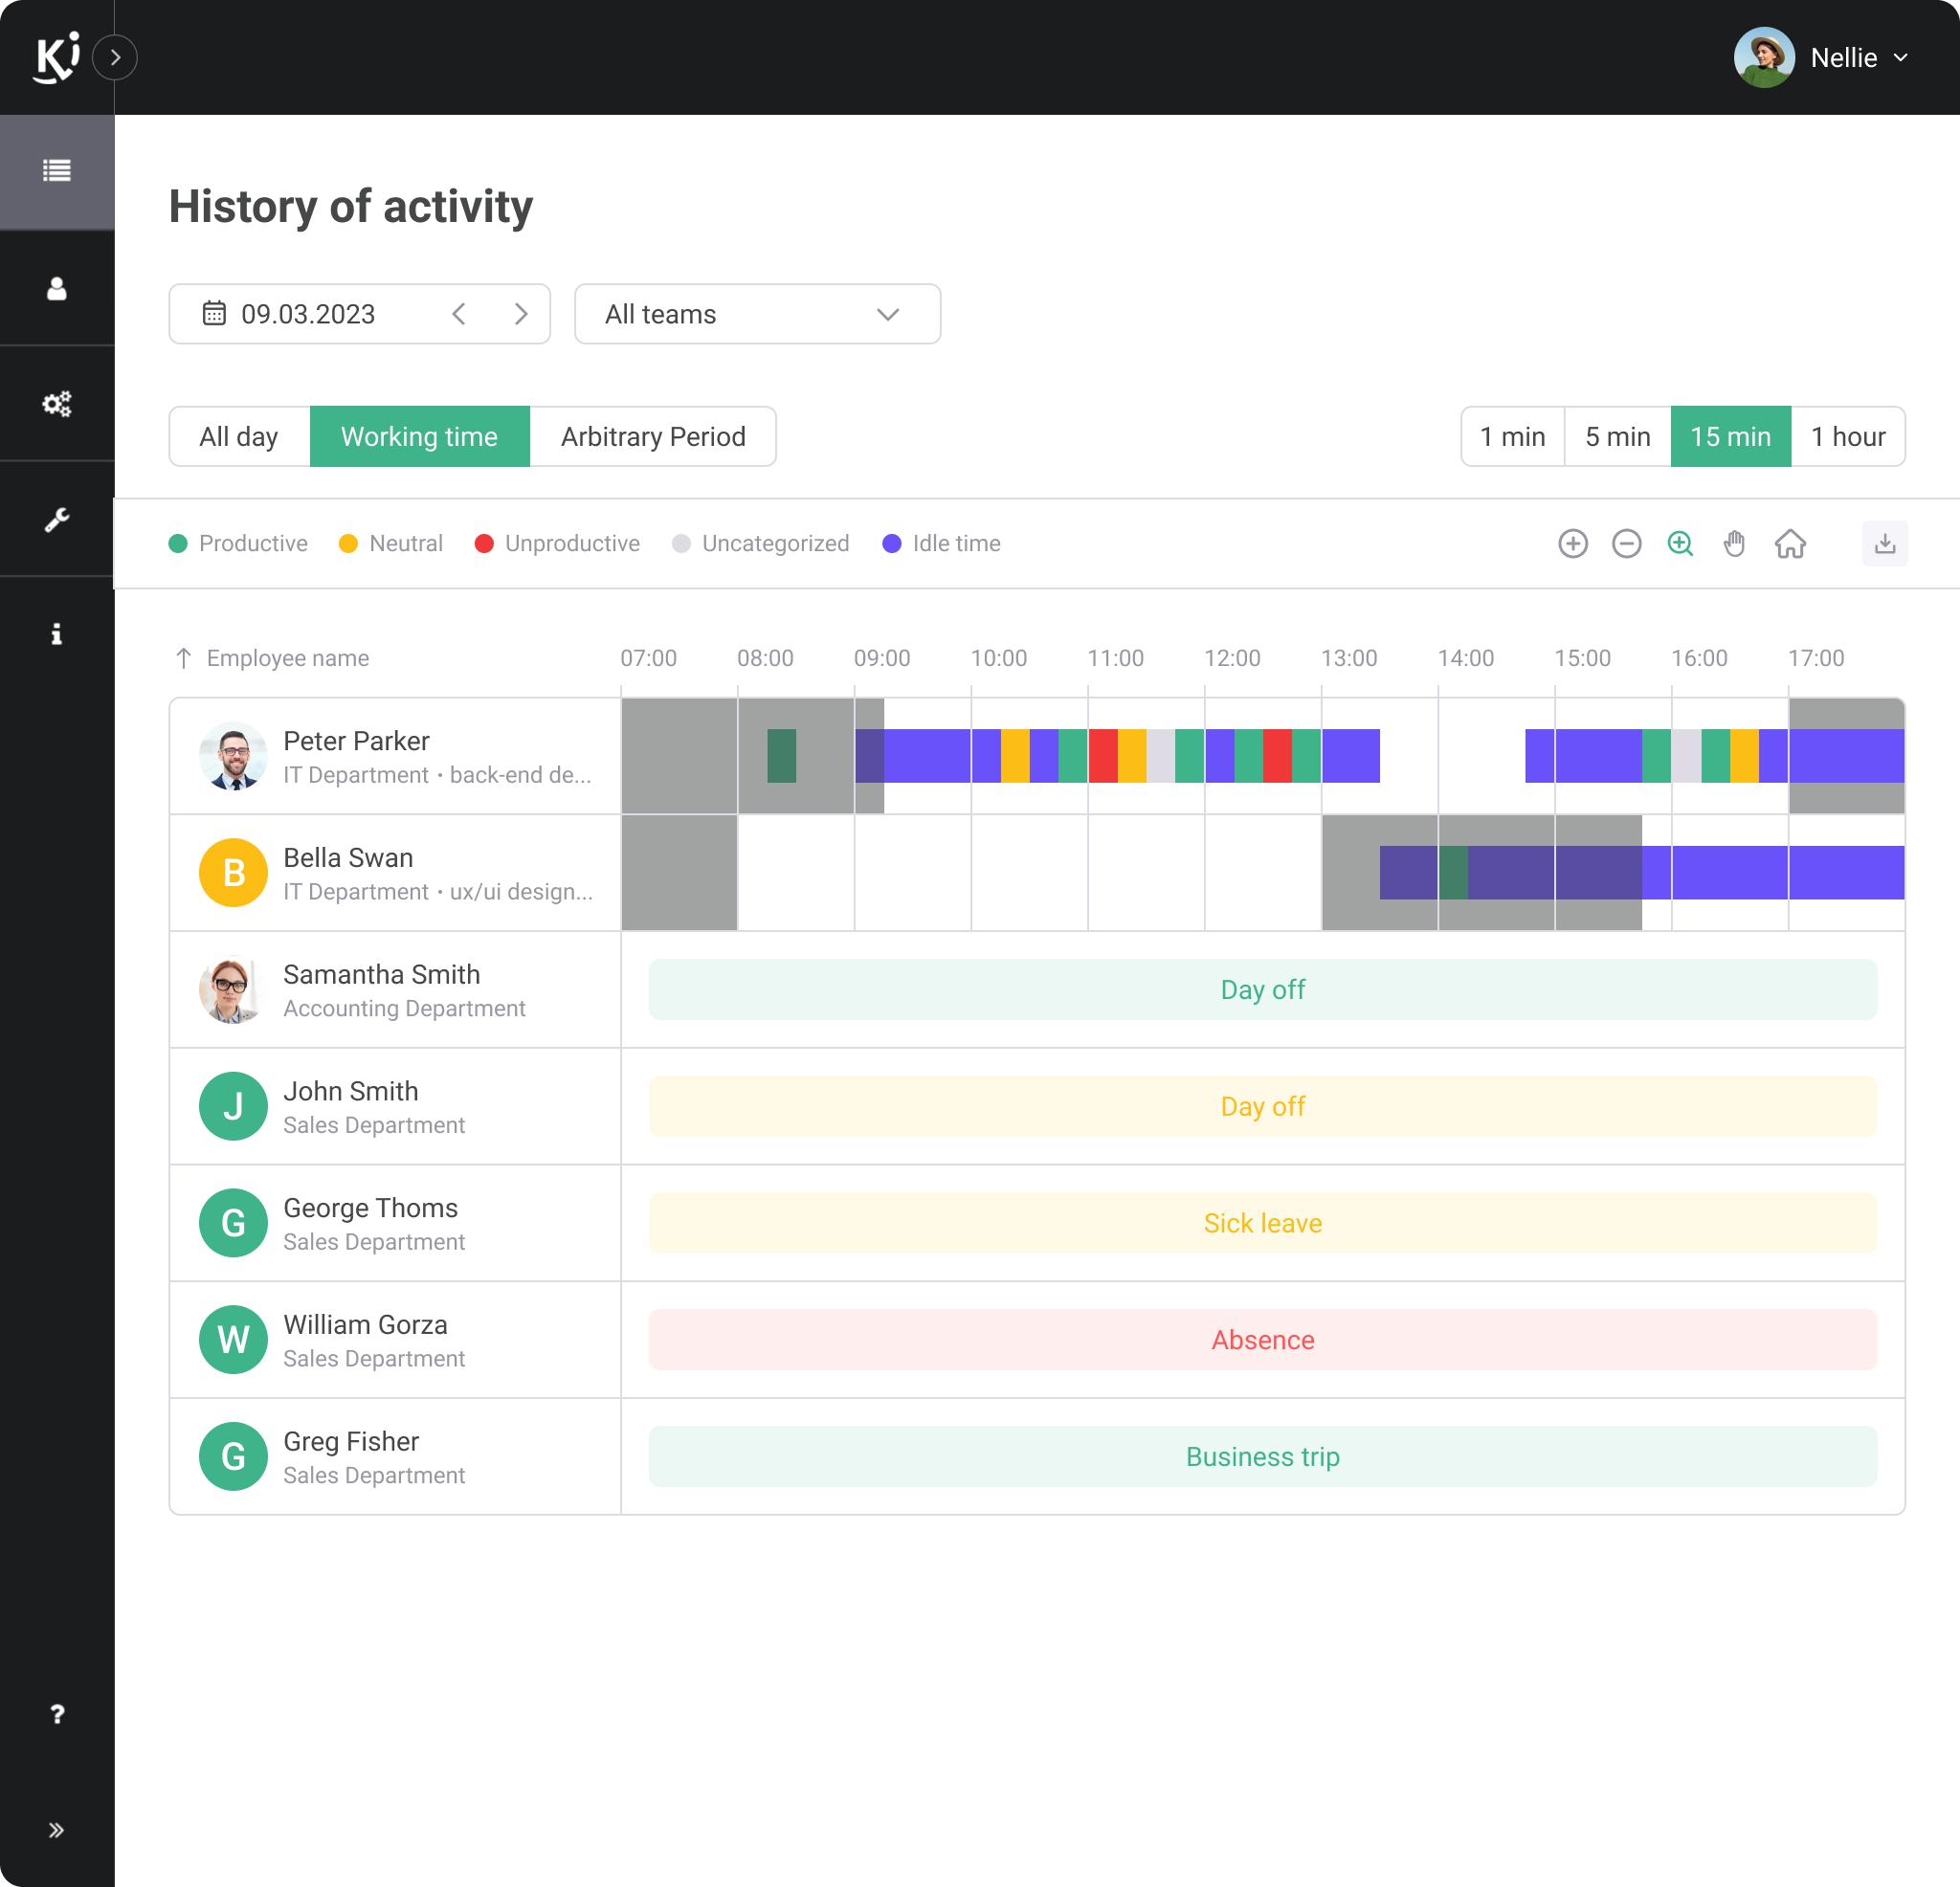
The "Activity History" report will show in chronological order the entire history of employee activity at their computers. Activity History is a convenient tool for analyzing employee activity and identifying growth points.
The "Activity History" functionality consists of two tiers - a graphical one, which allows managers to review employee activity visually, and a detailed one, with the help of which they can analyze the entire history of activities, both in chronological order and in terms of employee interaction with certain applications and sites or for a selected time period.
- To make it more convenient, all the activity of employees at their computers is divided into time grids.
- Time grids with adjustable increments of 1 minute, 5 minutes, 15 minutes and 1 hour are color-coded by the prevailing activity for the selected period (productive, unproductive, inactivity, etc.)
- A handy Magnifier option lets you zoom in and out of the selected time period.
- By selecting the grid you are interested in and clicking on it, you will be able to see the top 3 used applications for the selected time period.
- By clicking the "Read More" button you will jump to the detailed report, which will display the history of activities in chronological order, taking into account the name of the application or site, as well as the duration of the activity, their title and url. Both the abbreviated and detailed versions are available.
- Customizable screenshots (in development) will allow you to visually assess the nature of the employee's activity at the computer.
"Activity History" report shows in detail the entire history of employee activity at the PC, as well as recordings of incoming and outgoing audio from both phone call and video conferencing applications.
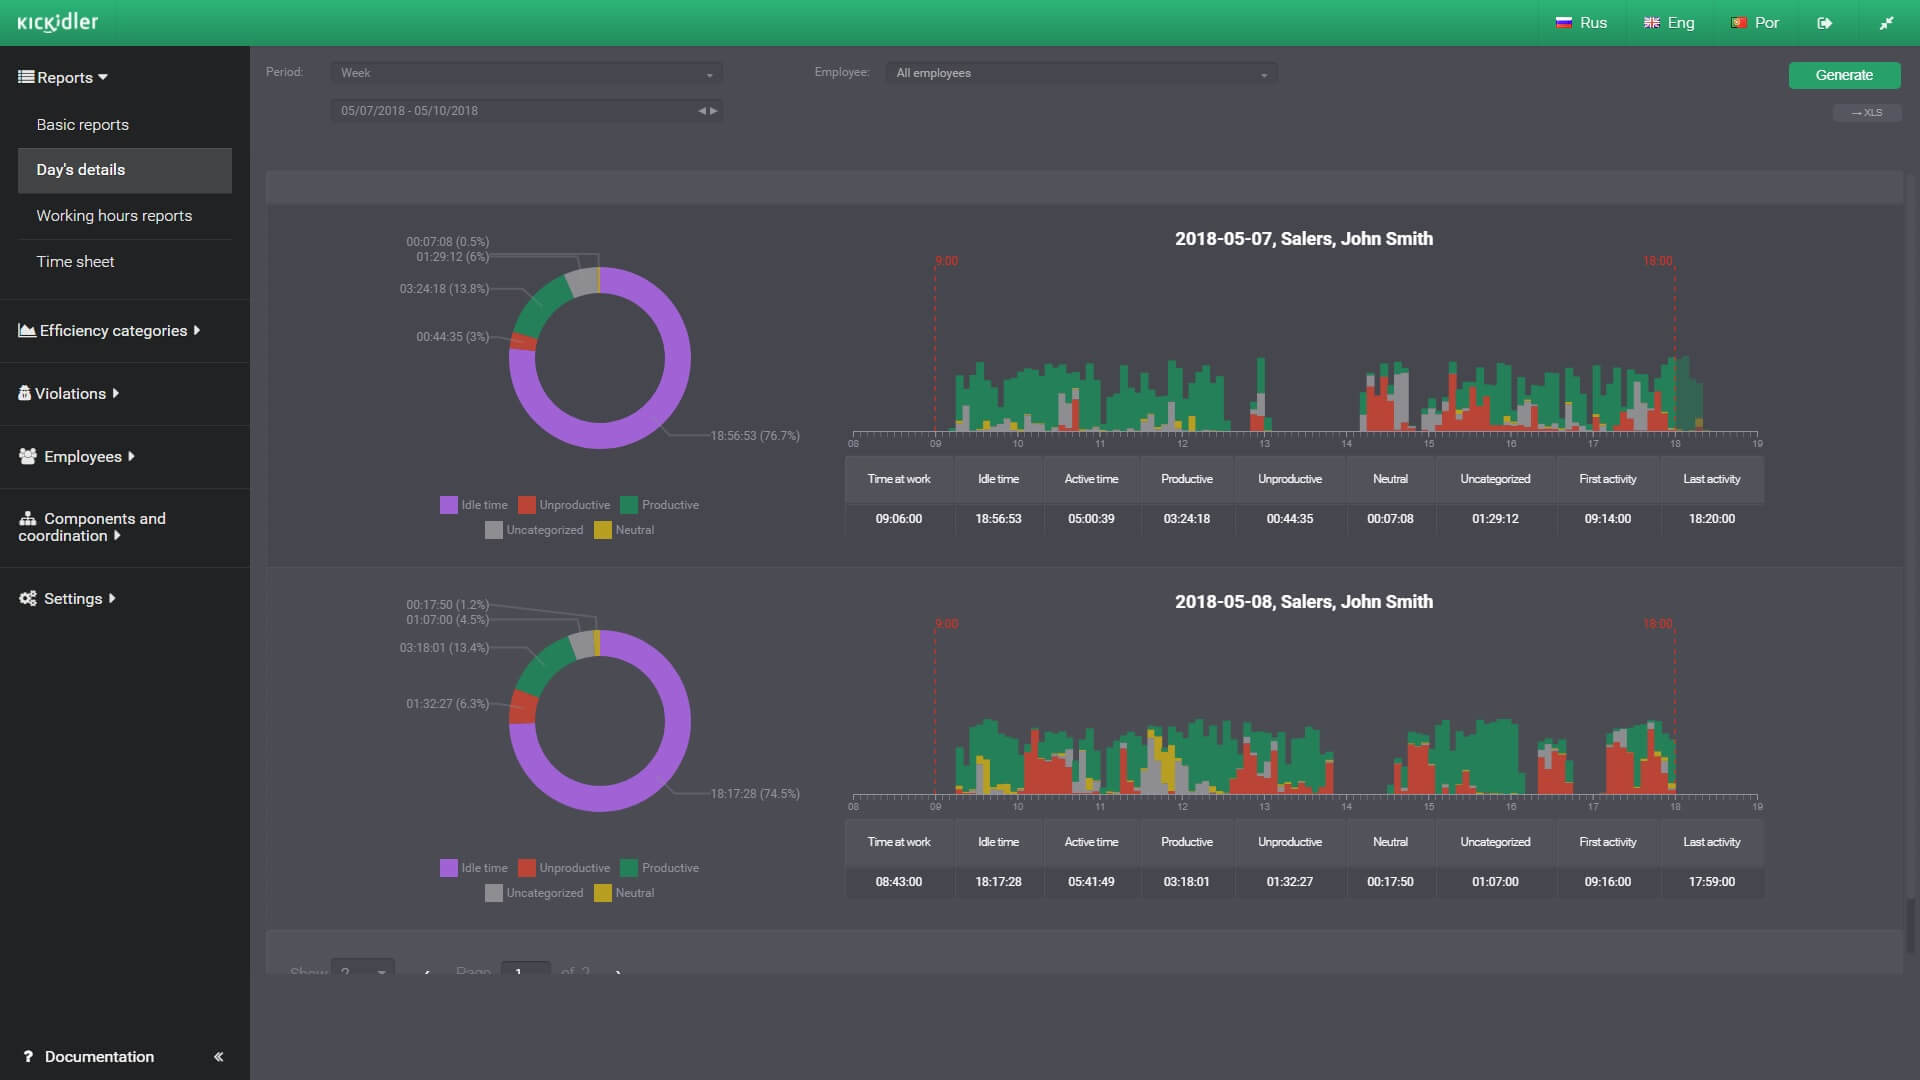
Day’s Details
- The report collects general information about the employee's work on the computer during the day. The report is located only in web interface of the Central server.
- The employee's activity is divided into efficiency groups and is displayed on pie chart of the time usage.
- The employee’s activity is shown on the chart. It’s divided into 5-minute intervals and groups of efficiency in the dynamics of the day. Using this chart, you can see whether the employee was late or left early due to the work schedule, as well as in what periods of the day he was the most productive or vice versa.
- General information about the employee’s activity is collected in the table. They are the start and the end of employees ' activities at the computer (actually the start and the end of a working day), time of activity in a productive, neutral, unproductive applications and applications without an efficiency category, the total amount of employees’ idle time at the computer (when the employee has not used the keyboard or mouse).
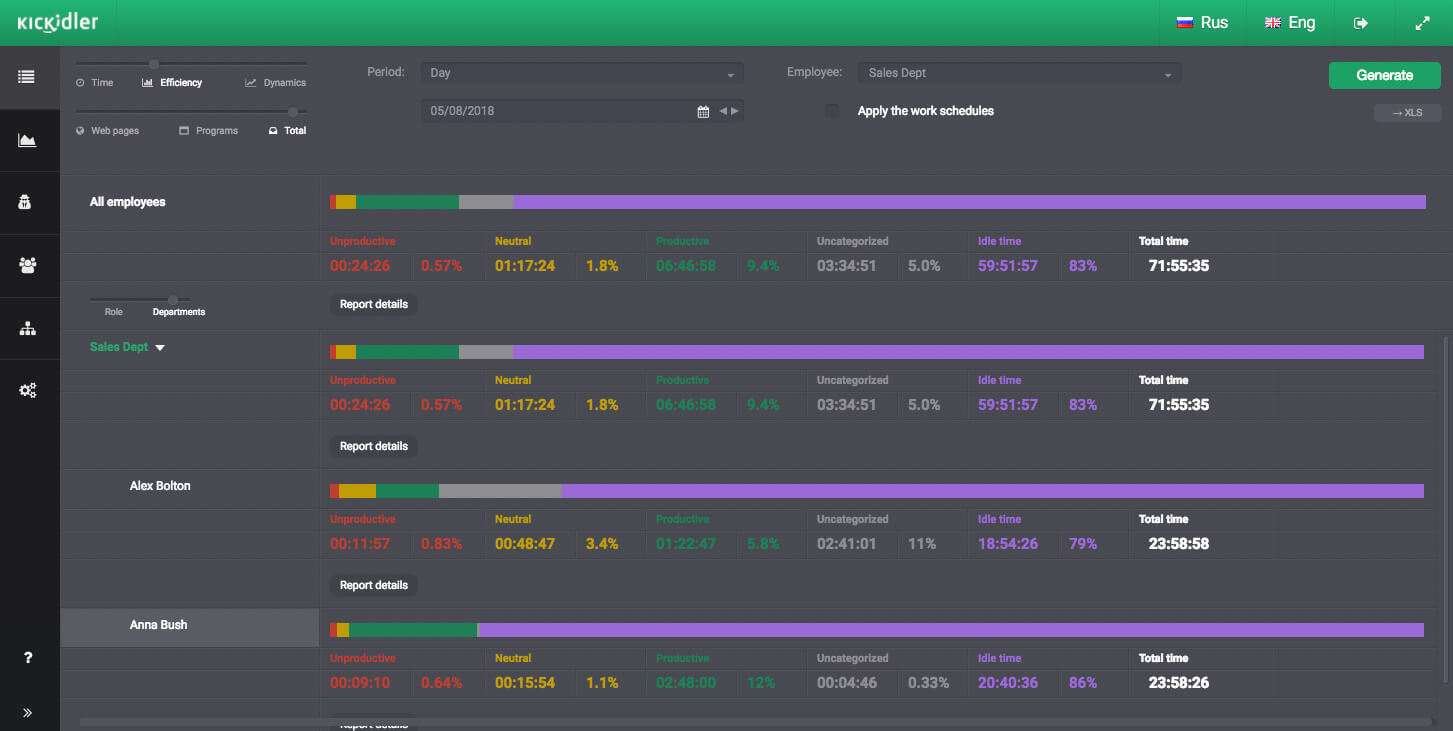
Efficiency Report
- Each application (program or site) has certain relevance to the workflow and can belong to one of the efficiency categories (productive, neutral, unproductive). For example, a work in CRM is productive, watching movies on the work PC is unproductive, using search engines is neutral.
- The efficiency report displays the application usage time according to the efficiency categories.
- We have already attached the most popular applications to the efficiency categories. But as practice shows, many applications that your employees use are not assigned to any category by default. Therefore, in the efficiency report such applications will be attached to "without category". They can be attached to any efficiency category in the reports’ section of in the Viewer program.
- The efficiency report also displays the application idle time (when the employee opened the application but did not use it).
- You might use the work schedules of your employees for generating the efficiency report.
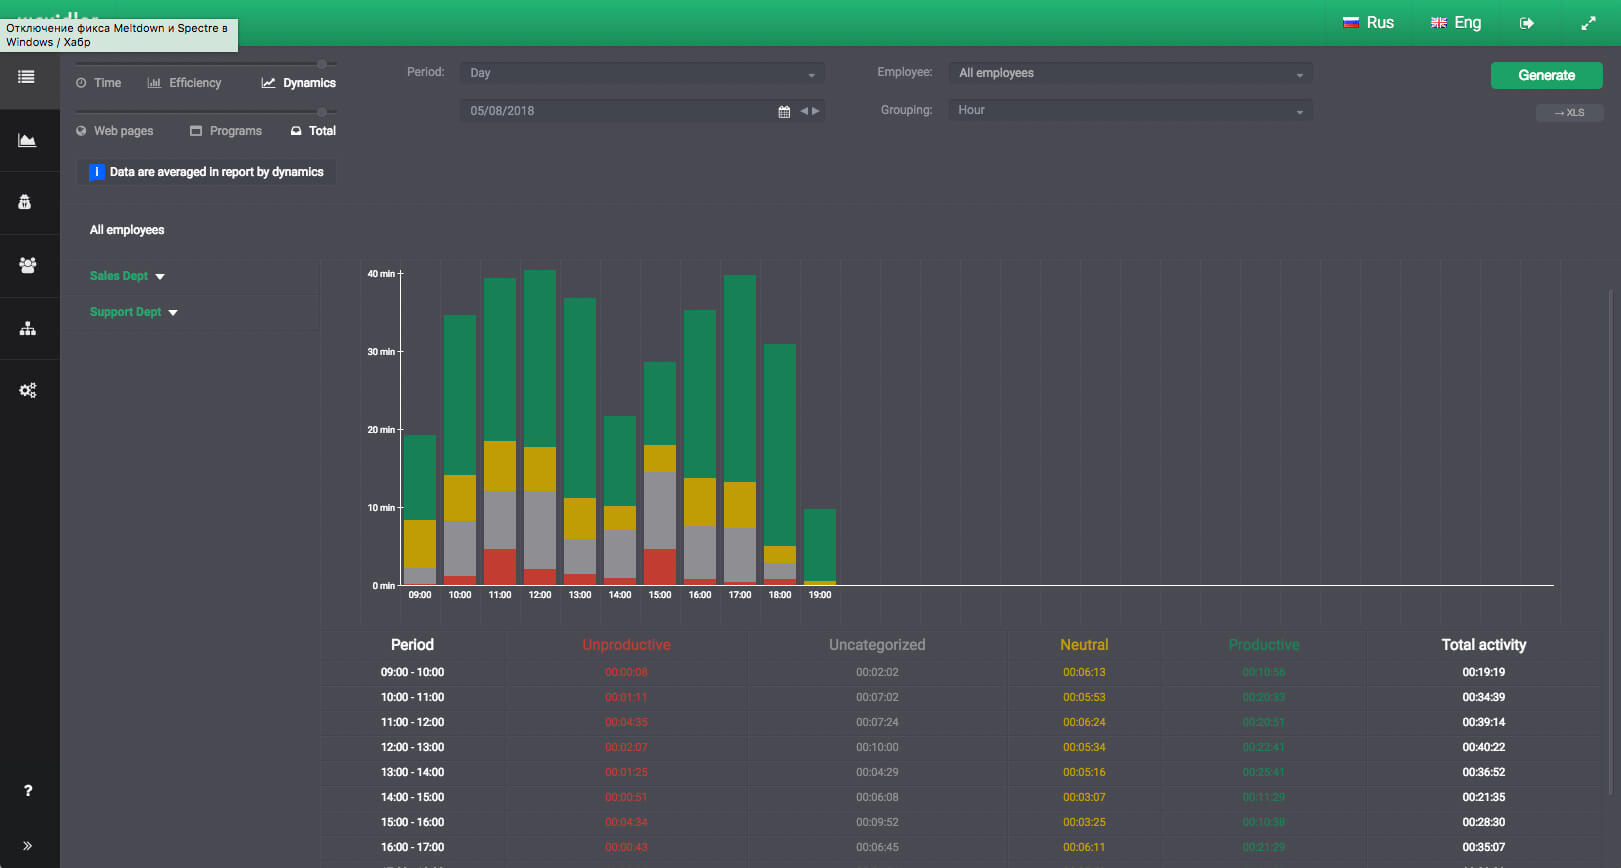
Dynamics Report
- Employees work differently at different times of the day. For example, some employees are more productive before lunch, while others are more productive after lunch. For better managing of the human resources of the company use the dynamics report.
- The report displays the distribution of employee activity by time for the selected period and the specified grouping. If you select a grouping by hour, you can see which hours of the day employees were most active and vice versa. If you want to know when employees work harder during the week or month, select the week or month grouping.
- According to the parameters specified in the report, a chart by dynamics of employees’ activity and a table with details are displayed.
- Employees ' activity on the chart is divided into efficiency categories. Each column shows the number of productive, unproductive, and neutral activities and activity without category.
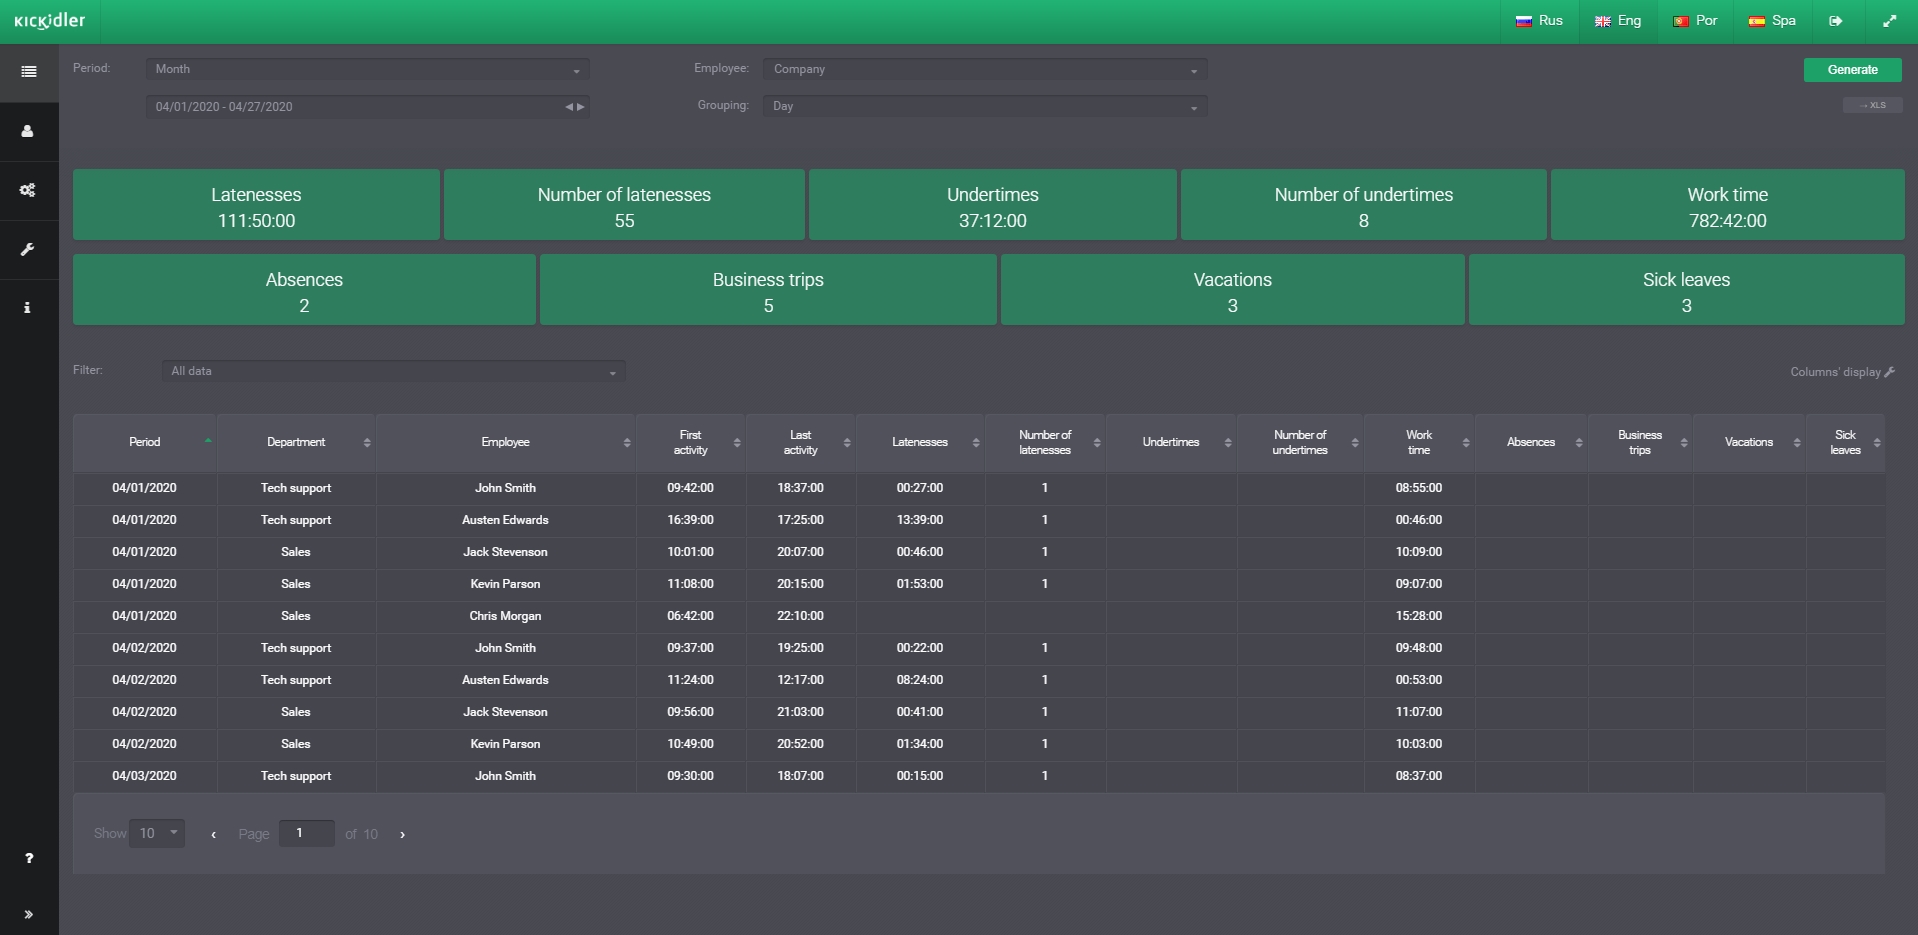
Working Hours Report
- The working hours report allows you to keep track of employees’ work time and identify deviations from the employees’ work schedules. This report is located in web interface of the Central server.
- The report displays the first and last activity of the employee at the computer on each of the work days.
- If the employee turned on the computer later than in his work schedule, the report displays a lateness. If an employee stops working on the computer before his work schedule, the report displays undertime. If the employee did not turn on the computer in a work day, the report displays absence.
- Above the main data table is located a summary with the number of latenesses, undertimes and absences.
- The tabular report data can be filtered by lateness or undertime and grouped by day, week, or month.
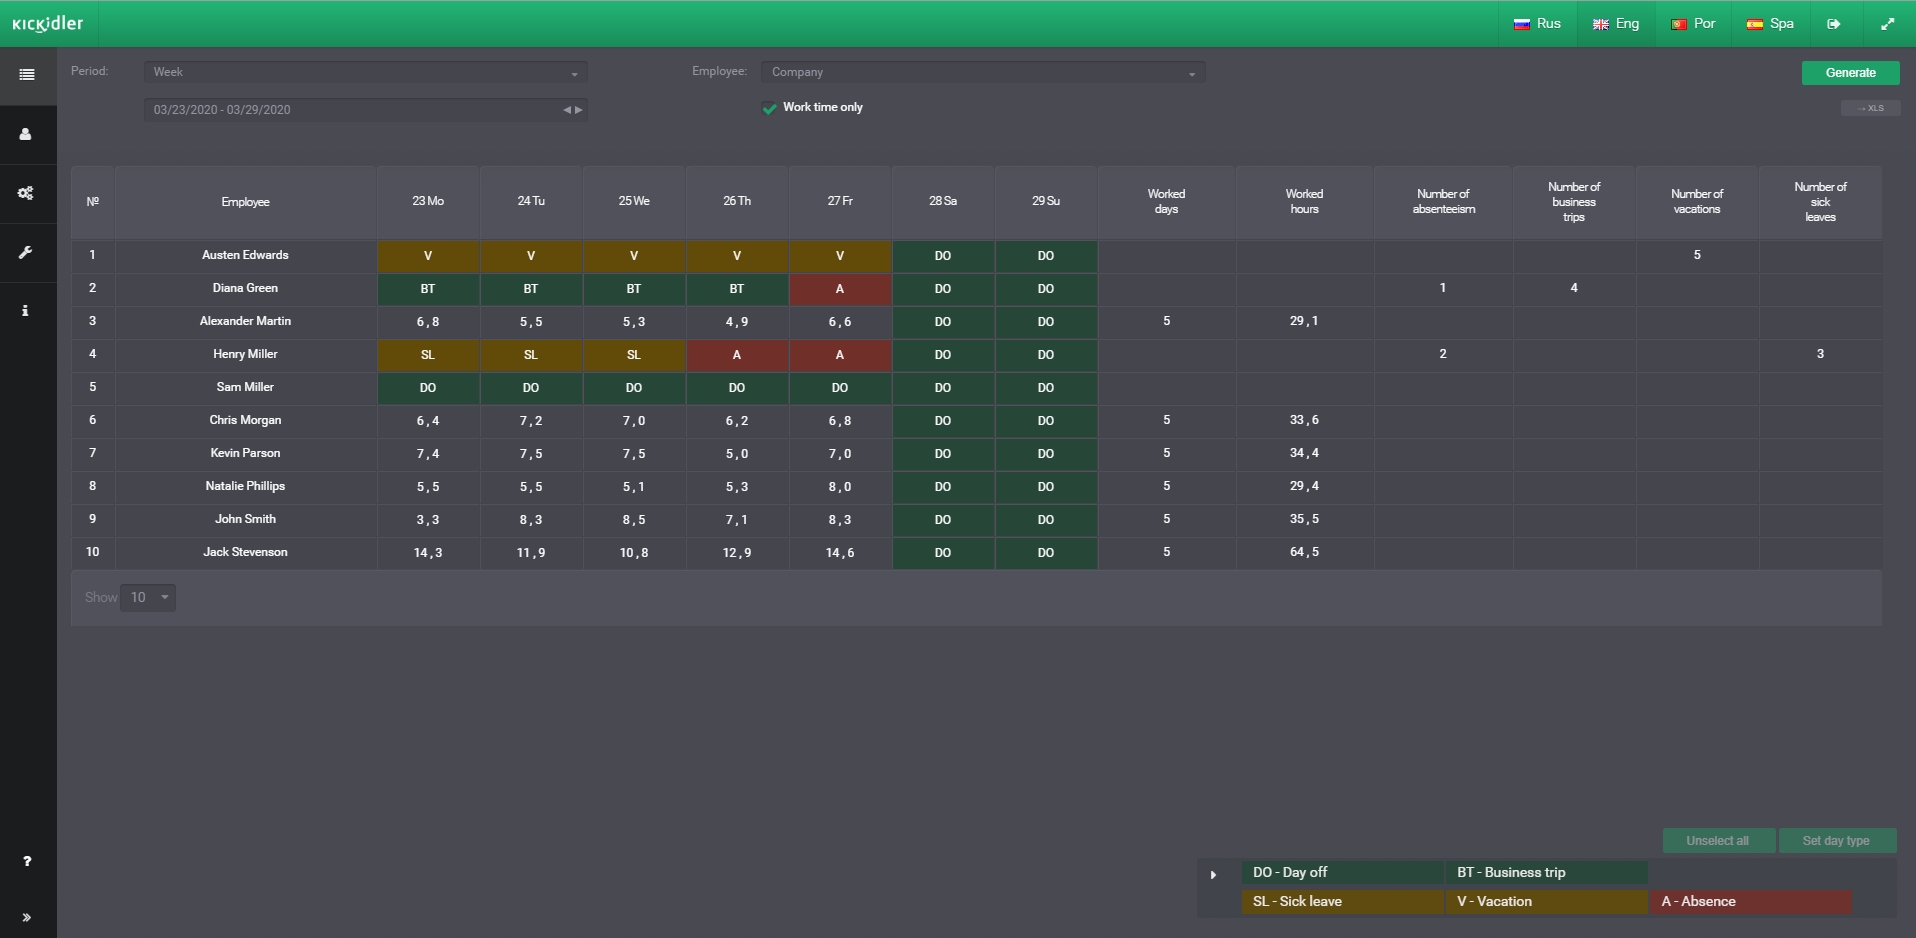
Time Sheet Report
- The time sheet report displays information on worked hours of employees for each calendar working day. This report is located in web interface of the Central server.
- The report can be generated both by week and by month.
- The report displays information about the total number of absences for the period and the number of worked days and hours by the employee.
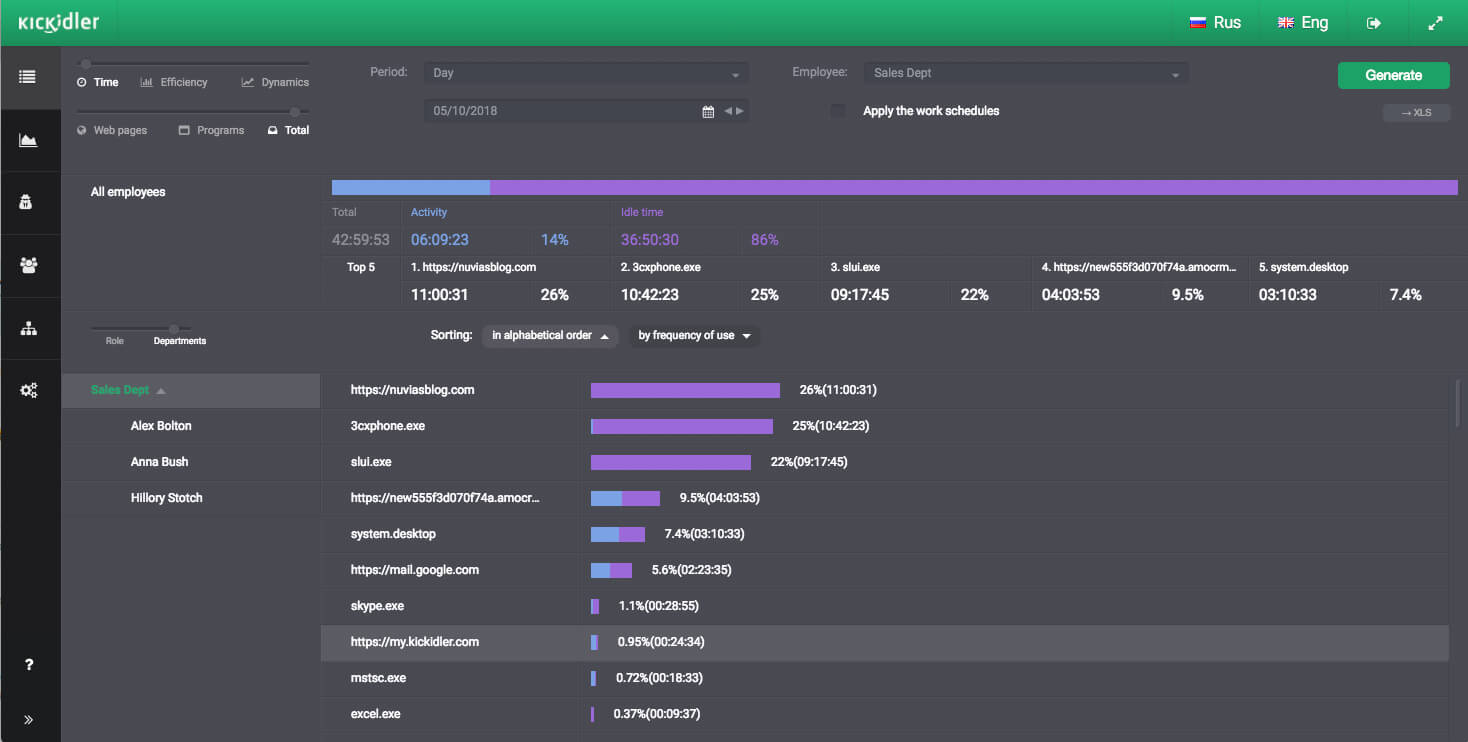
Time Report
- All programs and websites that were opened by the employees collect in the time report.
- For each of these applications collects work time of employees (active time) and idle time.
- The histograms of activity and inactivity are plotted by applications and arranged in descending order of usage time.
- The top 5 of the most frequently used apps are displayed.
- When you generate a time report, you can apply employees’ work schedules. In this case, the report displays information about application usage only during time by these schedules.
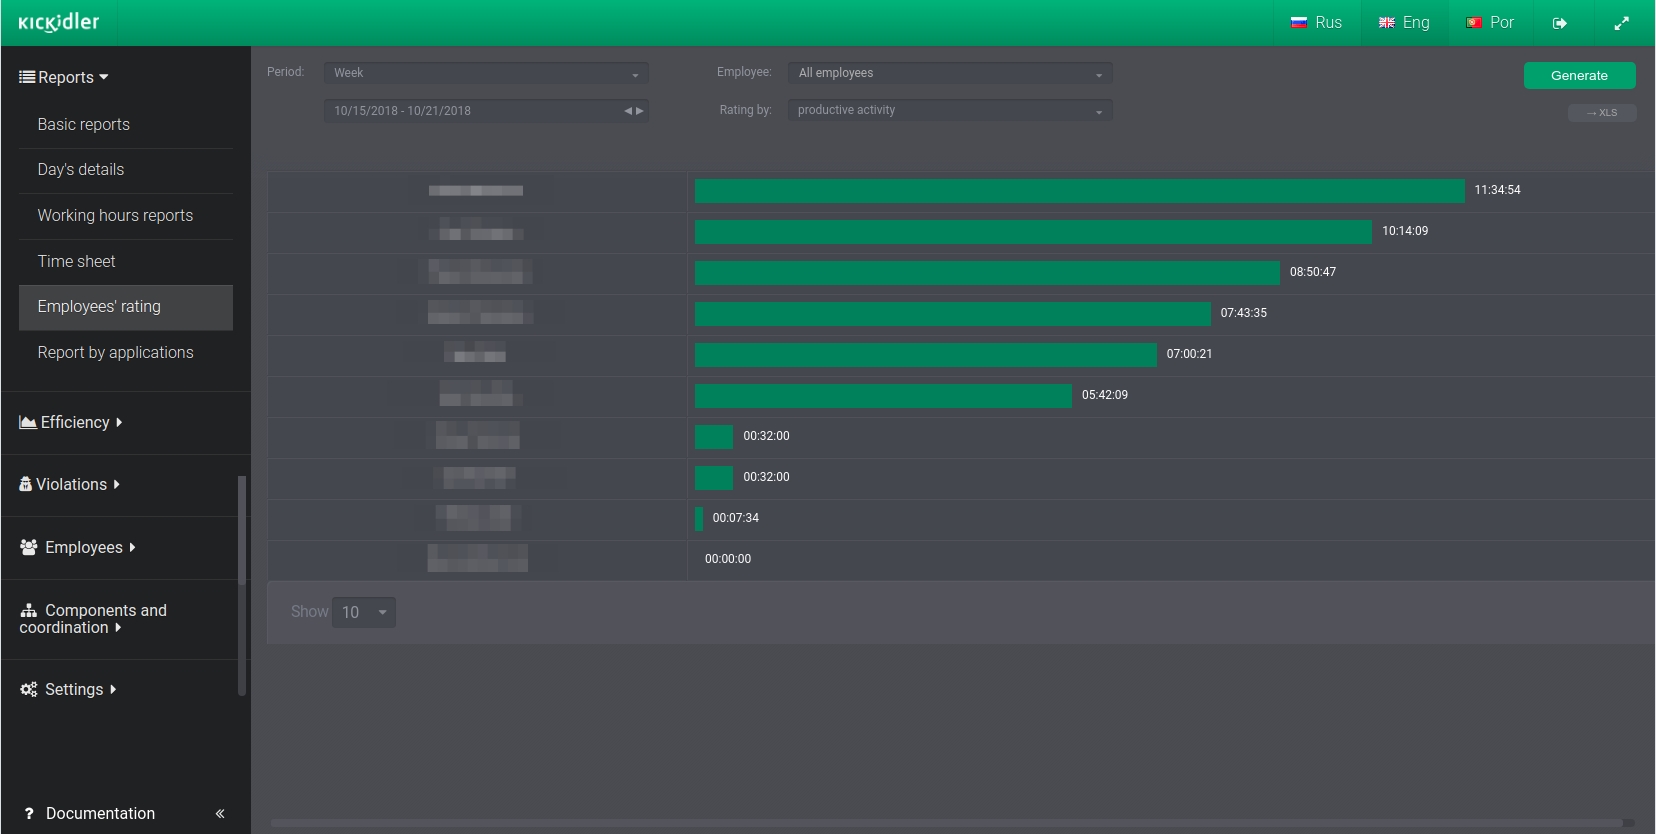
Rating of Employees
- "Rating of employees" report allows you to create the rating of employees by three types of activity: productive, unproductive or neutral.
- After you create the "Rating of employees" report, you'll see a figure that'll show in decreasing order the employees who devoted most of their time to the selected type of activity. This figure will also show the time spent on the chosen type of activity.
- You can make the rating of employees on any type of activity both for a set period of time (day, week, month, quarter) and for any period.
- The report will help quickly and efficiently reveal the most productive and unproductive employees in the company or in its department.
- The data obtained with the help of the "Rating of employees" report of the program of control of employees KeepActive (prev. Kickidler) can be used for motivation of personnel, encouragement of the best workers and detection of those who are the weak link in the team.
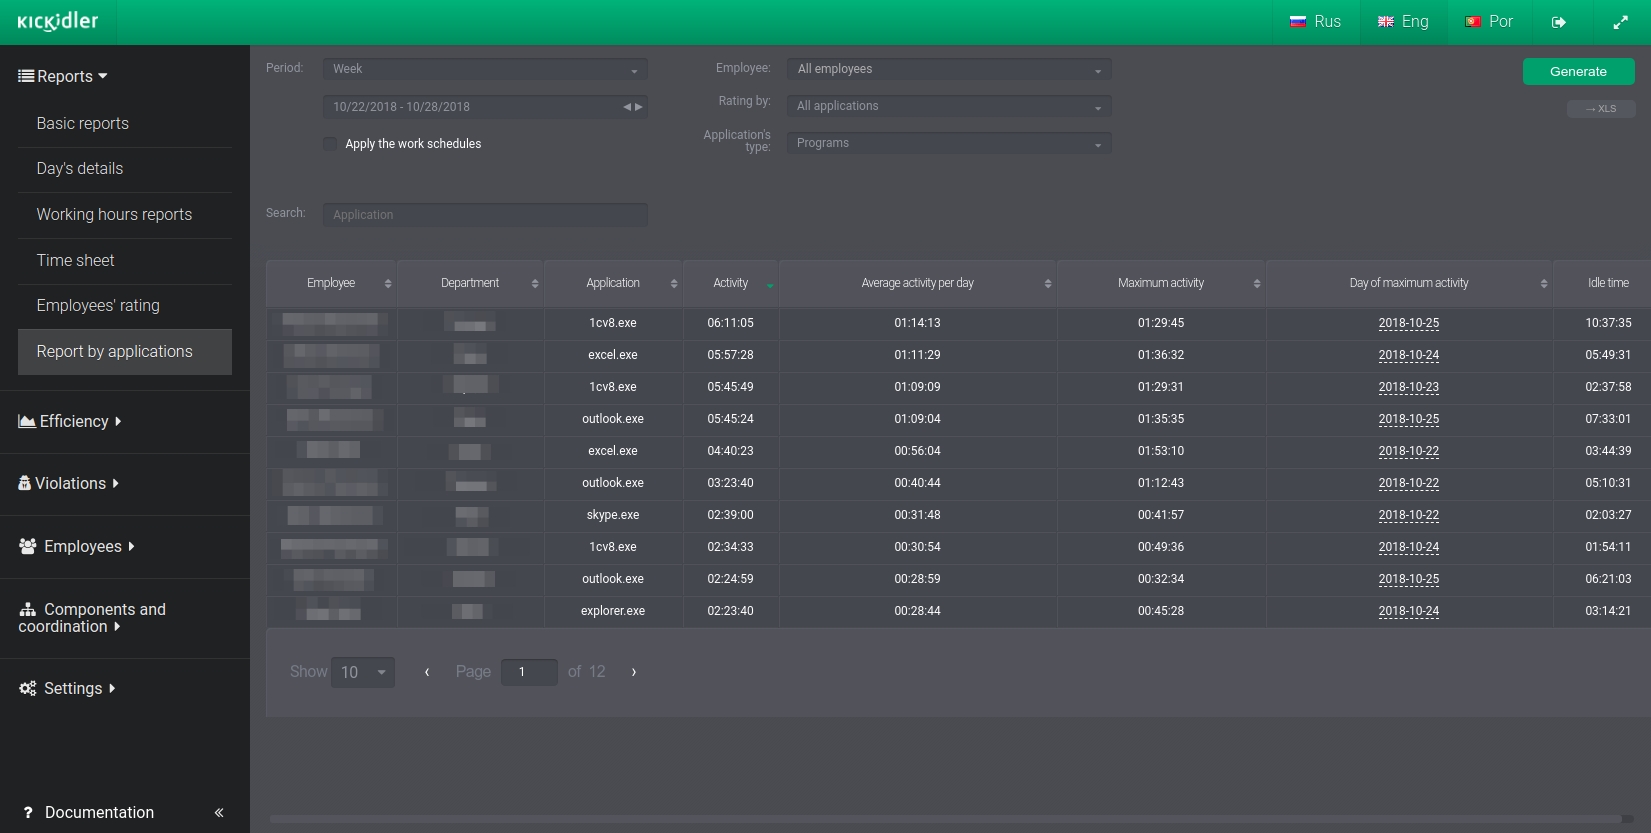
Report by Applications
- "Report on applications" allows you to find out which websites and apps were used by the employees at their computers during work hours, classify them as productive, unproductive or neutral and count time that was spent on particular website or in specific program.
- The report will also allow you to create the rating of the websites and apps by employee's time of interaction with them by a certain cluster (productive, unproductive, neutral).
- "Report on applications" will help management or HR specialists create more detailed picture of the employees' work day in order to understand what resources are needed the most during work of particular specialists and define what distracts employees the most.
- Blocking and banning of the unproductive websites often creates the situation where the employee begins to visit other similar resources. Control of use of the Internet on the working computer is much more effective. "Report on applications" doesn't ban anything; it simply motivates the employee to spend more time on something productive.


