
Workload analysis compares required work with the time, skills, and attention available to perform it. Managers use it to locate overload, spare capacity, bottlenecks, and commitments that the current team cannot meet.
It should describe demand and capacity in a common unit and at a level detailed enough to support a decision. A list of who looks busy does neither.
The basic workload equation
Use a common unit, usually hours, cases, tickets, tasks, or weighted work points.
Capacity gap = Available capacity − Required workload
A positive result suggests spare capacity. A negative result suggests a shortfall. The equation is simple; the difficult part is defining both sides honestly.
For a person working 40 hours:
- subtract approved leave;
- subtract recurring meetings and administration;
- subtract training or support commitments;
- apply a realistic focus factor for the role.
If 40 scheduled hours include 8 hours of meetings, 4 hours of administration, and 3 hours of support duty, planned delivery capacity is closer to 25 hours than 40.
Workload analysis methods
Choose the method that matches the work. Hours-based analysis suits projects and professional services, although estimates can hide complexity. Volume and handling time work for support, claims, and repeatable operations, but averages can conceal difficult cases. Weighted work points help with mixed tasks and must be recalibrated. Skills-based capacity is essential for specialized teams because total headcount can mislead. Flow analysis suits knowledge-work pipelines when status and timestamp data are reliable.
Most teams need two methods. A support operation might combine ticket volume with skill coverage; a product team might combine flow metrics with a rough capacity model.
When demand is uncertain, do not bury the range inside one average. Keep committed work in the baseline and model likely and surge scenarios separately. The point is to show which promises survive the high case and which work must move if it arrives.
Separate processing effort from calendar delay. A request may wait three days for approval but require only 30 minutes of labor. Adding headcount will not fix that queue if the real constraint is a decision right or a handoff; the workload model should show both effort and waiting time.
A practical workload analysis template
Step 1: Define the period and unit
Choose a week, month, sprint, or quarter. Use a unit people understand and can estimate consistently.
Step 2: Inventory demand
For every work category, record expected volume, effort per unit, total required effort, deadline or service level, and required skill. Use ranges when estimates are uncertain rather than hiding uncertainty in one precise-looking number.
Include committed project work, predictable operational work, support duty, and recurring obligations. Keep uncommitted ideas in a separate scenario rather than mixing them with the baseline.
Step 3: Calculate capacity
For each person or role, capture scheduled hours, leave, meetings and administration, other fixed work, available capacity, and the skills that limit assignment. Keep skills visible: 40 available hours from the wrong role do not close a specialized capacity gap.
Do not assume every available hour is interchangeable. Ten hours from a database specialist cannot automatically cover ten hours of design work.
Step 4: Match work to capacity
Allocate at the role or skill-pool level before assigning every task to a named person. This shows whether the plan is structurally possible without turning the model into a fragile calendar.
Step 5: Review the gap
For each shortfall, choose an explicit response:
- reduce or defer scope;
- move a deadline;
- rebalance work;
- automate or simplify the process;
- add temporary capacity;
- hire or train for a missing skill;
- accept the risk with an owner.
“Ask the team to work harder” is not a capacity plan.
Metrics that make workload visible
Utilization
Utilization compares time assigned to productive or billable work with available time. It is useful for planning, but very high utilization leaves no buffer for urgent work, learning, or recovery.
Work in progress
High work in progress often means people are switching among too many items. Track how many active items a person or team carries alongside how many they finish.
Cycle time and backlog age
Cycle time shows how long work takes from start to finish. Backlog age reveals items that are not moving. A growing old backlog can signal a capacity or priority problem even when current output looks stable.
Overtime and after-hours work
Occasional peaks happen. A repeated after-hours pattern suggests that the demand model, staffing, or process needs attention.
Rework
If capacity is consumed by correcting errors, the answer is not always more headcount. Track why work returns and whether the cause is unclear requirements, rushed delivery, or missing quality controls.
How to use work-activity data without misreading it
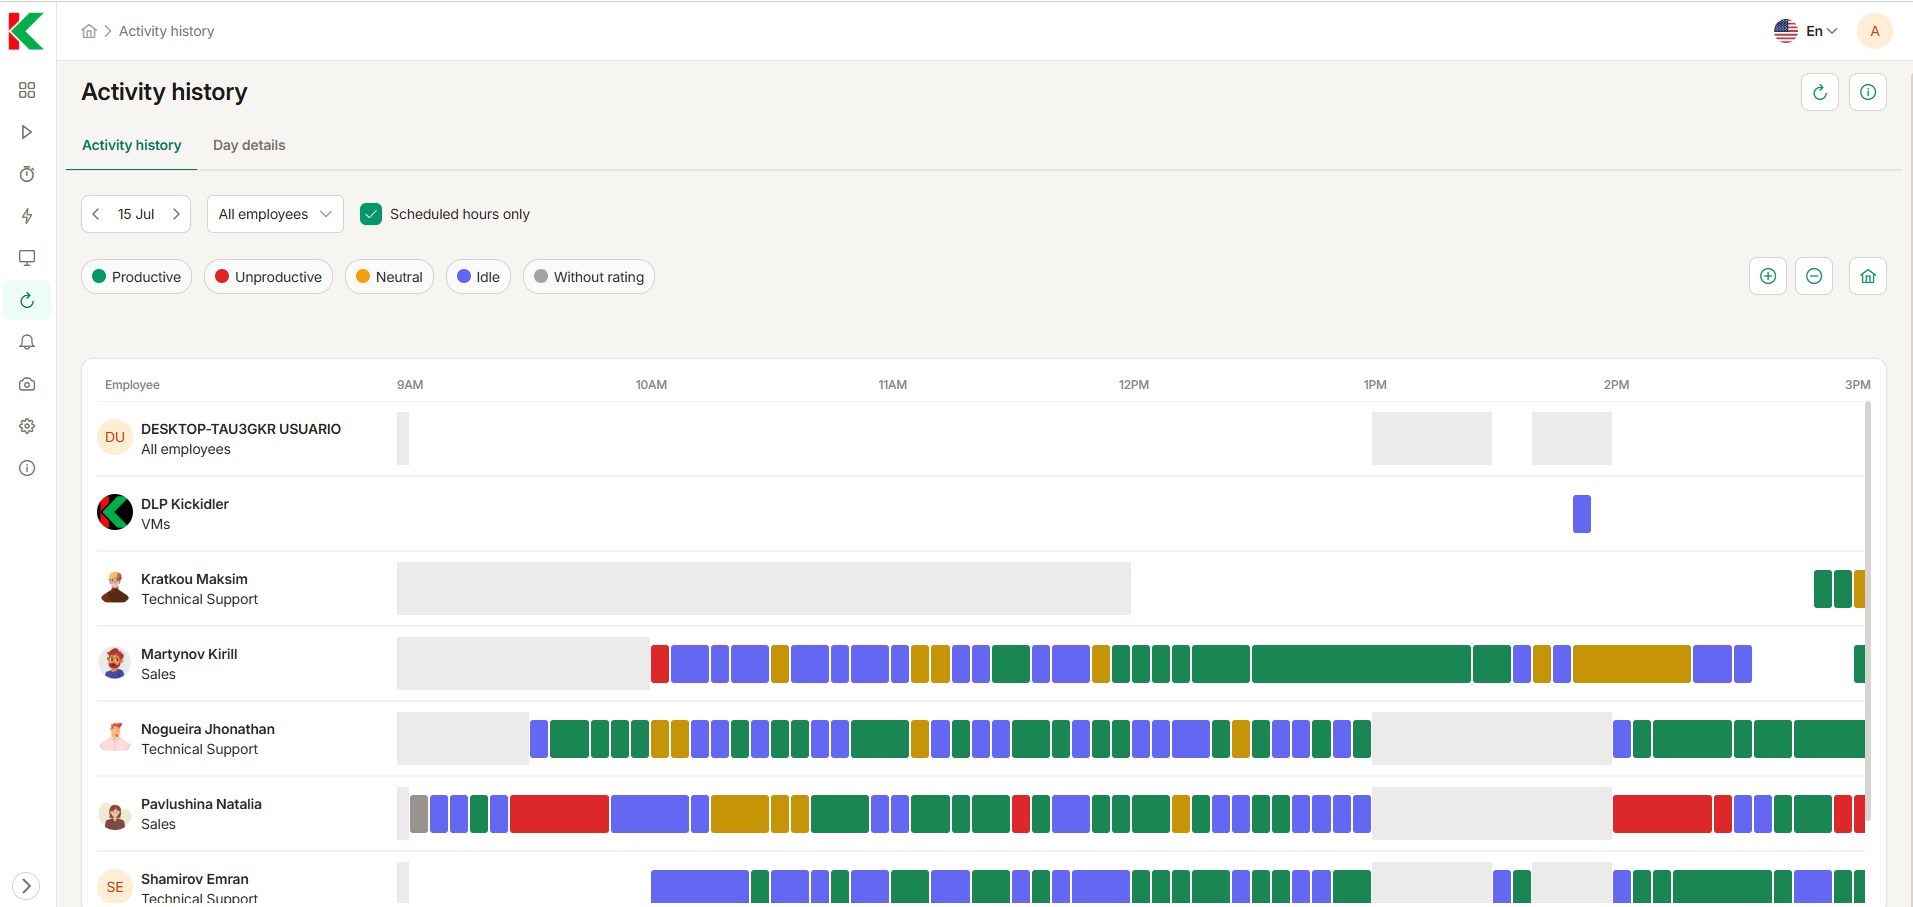
KeepActive work-time reports can help validate meeting load, active work periods, and recurring application patterns. Project tracking adds time by project or task. Use that evidence to refine assumptions, not to declare that every quiet period is unused capacity.
A researcher reading and thinking may create little visible input. An overloaded employee may appear highly active while moving five projects forward very slowly. Pair activity data with demand, completed work, and manager context.
A short workload review agenda
Run a 30-minute review each week:
- What new demand entered the system?
- Which deadlines or service levels are at risk?
- Where does demand exceed available skill or time?
- Which work is blocked or aging?
- What will be delayed, reassigned, simplified, or stopped?
- Which assumption should change in the next plan?
The value of the review is the decision, not the spreadsheet.
Workload analysis traps that distort the picture
- Treating scheduled hours as productive capacity.
- Counting heads without considering skills.
- Using one average effort for very different work.
- Loading every person to 100%.
- Ignoring support, meetings, and administrative work.
- Measuring busyness instead of flow and completion.
- Adding people before fixing avoidable rework.
- Leaving low-priority work in the plan indefinitely.
Use Little's Law to test the queue
For a reasonably stable workflow, Little's Law gives a useful check: work in progress equals throughput multiplied by cycle time. If a team completes 40 cases a day and average cycle time is five days, roughly 200 cases should be in the system. A much larger backlog suggests hidden waiting, stale work, or inconsistent definitions.
Use the relationship as a diagnostic, not a performance target. Reducing work in progress can shorten cycle time only if intake and priorities are controlled. If managers keep adding urgent work, closing easy cases may improve throughput while old complex cases continue to age. Segment the queue before changing staffing.
Turn the analysis into a capacity decision
A credible analysis should let a manager say which work will be delayed, moved, simplified, or dropped. If every item remains a priority after the analysis, the workload problem has only been described.
