 English
 Русский
 Português
 Español
 Հայերենով
 Türkçe
 Български
 中文
中文 ქართული
 Français
 日本語
日本語 Қазақ
Қазақ- Work with Quadrator
- Employees group monitoring
- Violations setup in Quadrator
- Violations panel
- Activating and deactivating the violation filters
- Activating and deactivating groups of violations
- Specifics of working with violations
- Quadrator grid setup
- Settings selection for cell monitoring
- Violation triggering
- Active application in the cell
- Tab creation
- Employee monitoring
“Tracker” section is intended for online monitoring for employees work. You can view activities on employees’ displays and have ability to analyze their work. In this section you can monitor the employees group (through Quadrator) and specific employee (through interfaces “Monitors”, “Programs”, “Violations”). Quadrator has flexible settings system, which allows monitoring events of your interest.
Work with Quadrator
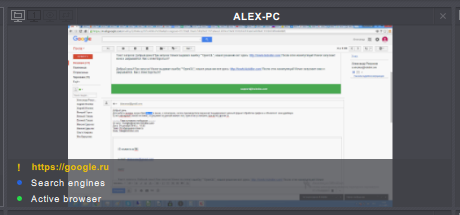
You can monitor employees’ displays in online mode in Quadrator cells. If the employee is active, the cell will look like this:
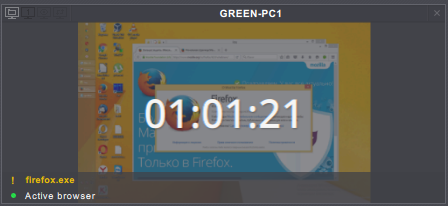
If the employee is inactive for some period of time, the timer counting employee’s display inactivity time will be displayed in cell. The cell will look like this:
Right-click on employee cell will show context menu:
- clear - removes employee from the cell (only for extended version),
- expand - switches to monitoring for employee in the cell,
- history - switches to video viewing for employee in the cell,
- remote control - switches to the "Remote control" section (only for extended version).
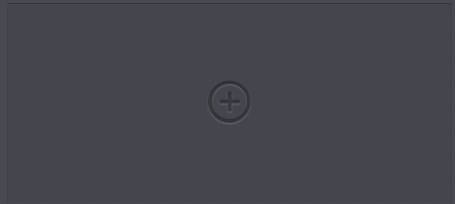
If the cell has no employee yet, it will look like this (only for extended version):
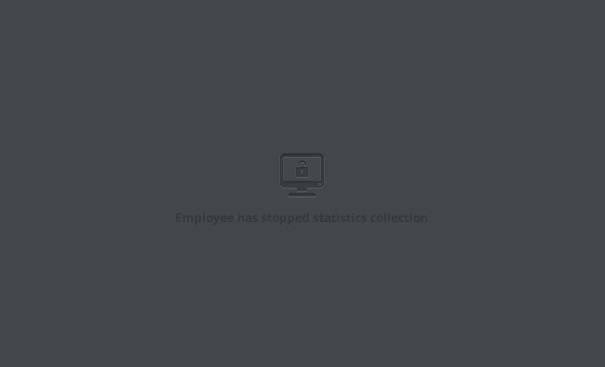
If an employee is allowed to pause monitoring using the self-monitoring interface and the employee has paused the data collection, the box may look like this:
If video collection for the employee is disabled, the box will look like this:

If the viewer isn't allowed to view videos for said employee, the box will look like this:
If the employee has Kickidler TimeTracker license assigned to the grabber, the box may look like this:
Employees group monitoring
Violations setup in Quadrator
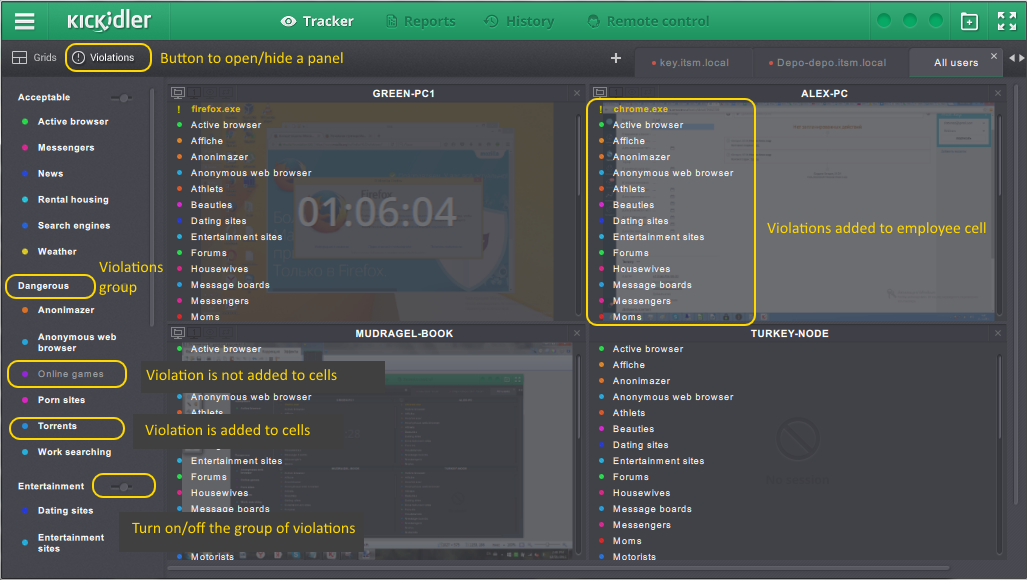
Violations are specified policies, upon committing which a marker with a color indicator and the name of the violation lights up in the cell of the Quadrator. Read here to find out how to create and edit violations and groups of violations.
For the program to display the violations in the cells, such violations can be activated. You can activate an individual violation or the whole group.
If there is no need to monitor the violations in the cells, such violations can be deactivated. Similarly to the activation, you can deactivate an individual violation or the whole group.
Violations panel
To activate or deactivate violations in the Quadrator, you need to open the violations panel by clicking on the "Violations" button.
The panel contains a list of violations, divided into groups.
The violations panel is only available in the extended version of the Viewer.
Activating and deactivating the violation filters
Potential states of violations:
- Activated violations are highlighted white. Such violations are either activated in all cells of the Quadrator or at least in one cell.
- Deactivated violations are darkened and deactivated in all cells of the Quadrator.
To activate a violation in all cells of the Quadrator:
- select the deactivated violation that you want to turn on,
- click on the violation,
- in the dialog box that opens, click on the "OK" button.
Activated violations will be displayed in cells with a color marker.
To activate a violation in only one cell, you need to drag the violation from the violations panel to the cell of your interest.
To deactivate a violation, you click the name of the violation in the panel again or drag the violation from the cell to the settings panel.
Activating and deactivating groups of violations
Potential states of groups of violations:
- Activated groups of violations are highlighted white. Such groups have either all or at least one violation activated.
- Deactivated groups of violations are darkened. Such groups have all violations deactivated.
To activate a group of violations in all cells of the Quadrator:
- select the deactivated group of violations that you want to turn on,
- click on the name of the group of violations or on the switch for the group in the violations panel,
- in the dialog box that opens, click on the "OK" button.
To activate a group of violations in only one cell, you need to drag the group of violations from the violations panel to the cell of your interest.
To deactivate a group of violations, you click the name of the group of violations again.
Specifics of working with violations
Activating and deactivating violations and groups of violations in one Quadrator tab doesn't affect other tabs.
When you create a new cell within a tab, it automatically contains all activated violations and groups of violations.
When you delete all cells from a Quadrator tab, all filters of violations and groups of violations get disabled.
By default, when you create a new Quadrator tab, all violations and groups of violations are automatically enabled.
Quadrator grid setup
Quadrator grid setup panel opens and closes with click on button "Grids". You can select the best cells layout on display for viewing.
Possible variants can be selected according to display orientation — horizontal or vertical. According to selected orientation user can select the best Quadrator grid for viewing. First grid in list can be stretched without limits in height and width. Other grids have fixed width and can have no more than four cells.
Addition of cells
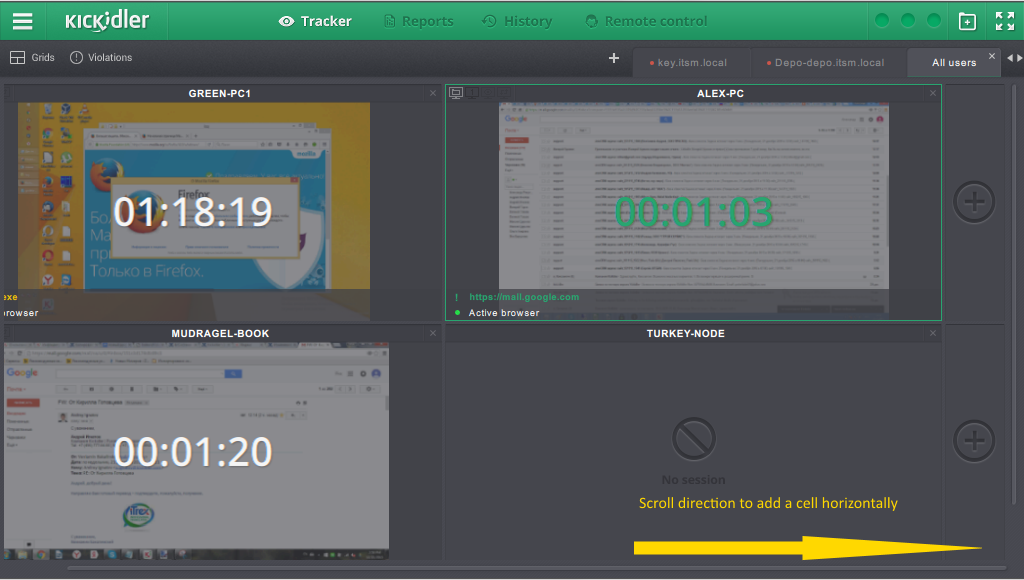
If you want to add cell into Quadrator, scroll to right or bottom edge of display until ribbon with icons ![]() . appears. You can add cells horizontally (right edge) only if adaptive grid is used (uppermost in the settings panel).
. appears. You can add cells horizontally (right edge) only if adaptive grid is used (uppermost in the settings panel).
Quadrator cells moving
You can move the cell in Quadrator by dragging it to the new place with mouse. Cell (initially not empty), which filled this Quadrator area, will go to the moved cell place.
Adding of employee
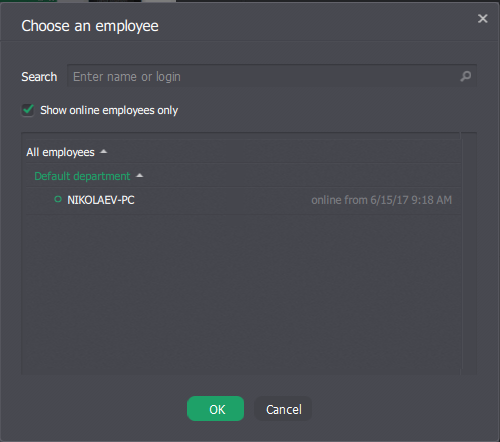
You can add employee only in empty cell. After clicking on icon ![]() employee selection window appears. By default in employees’ list you can see only online employees.
employee selection window appears. By default in employees’ list you can see only online employees.
Deleting of employee
To delete employee from the Quadrator cell, click on the cross in top right corner. After this you can add new employee to the cell or restore deleted employee.
Settings selection for cell monitoring
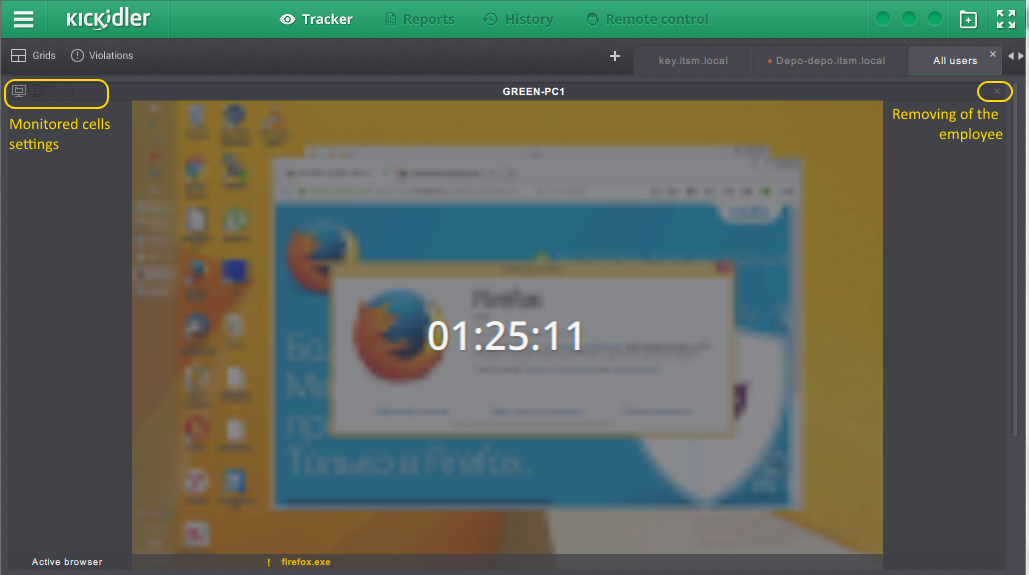
There are buttons for setup monitoring mode in the top left corner of the cell. You can select only one icon. Selected icon will be highlighted with green color.
Icons have the following designations:
![]() /
/ ![]() - is used to show only active application.
- is used to show only active application.
![]() /
/ ![]() - by clicking you can select display to monitor. This icon will be available if employee has two or more displays.
- by clicking you can select display to monitor. This icon will be available if employee has two or more displays.
![]() /
/ ![]() - show in cell the display with user activity. This icon will be available if employee has two or more displays.
- show in cell the display with user activity. This icon will be available if employee has two or more displays.
![]() /
/ ![]() - show video from all employee’s displays switching it after certain amount of time (1 second). This icon will be available if employee has two or more displays.
- show video from all employee’s displays switching it after certain amount of time (1 second). This icon will be available if employee has two or more displays.
Violation triggering
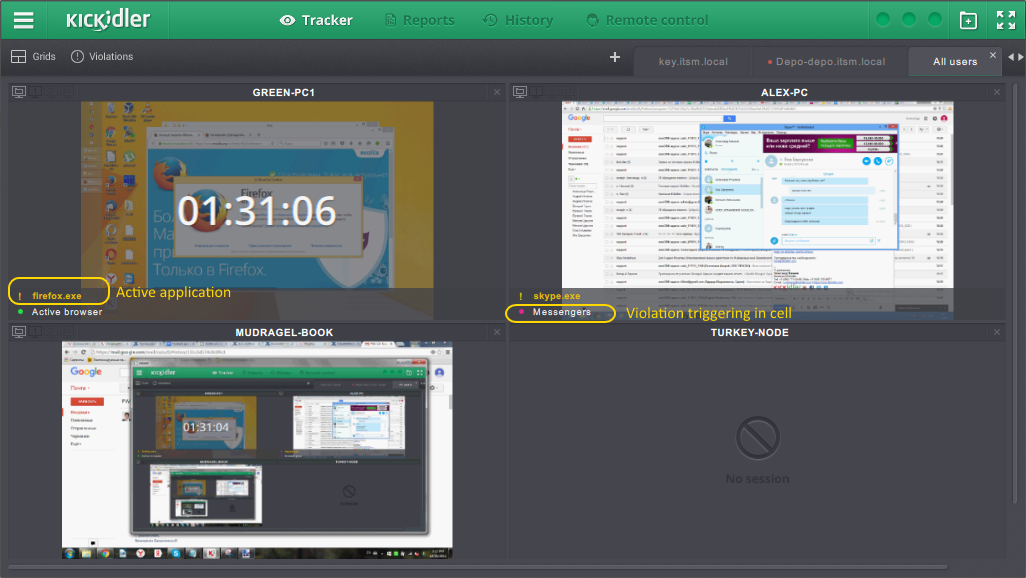
When employee makes somewhat that corresponds to violation, a string with the name of violation and a color marker appear in the cell. The string will not disappear until violation takes place.
Active application in the cell
In the employee cell the string is displayed with name of active application and icon ![]() . Besides, the cell will have border with corresponding color. Color of the string depends on efficiency of the application.
. Besides, the cell will have border with corresponding color. Color of the string depends on efficiency of the application.
Tab creation
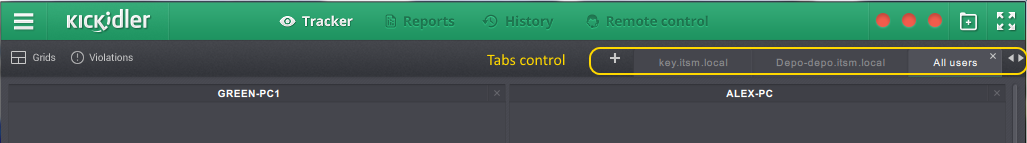
To add new tab, use the "+" button in Quadrator’s top right corner. In the appeared window enter a name for the tab and select employees, which will be the part of the tab. To add the employee, click the arrow to the right of employee’s name. Names of employees added to new tab appear in the list on the right. To remove the employee from tab, use the icon ![]() to the right from employee’s name. Icons for adding/removing of the employee appear when cursor hovers over string with the name of the employee.
to the right from employee’s name. Icons for adding/removing of the employee appear when cursor hovers over string with the name of the employee.
Switching between tabs
You can switch to the tab in Quadrator by clicking on its name or using "<" / ">" buttons in the top right corner.
Tab removing
To remove the tab, click on the cross to the right from the tab name.
Attention!
When you delete information about tab content, it is removed completely without any chance of recovery. If you need tab with the same content you will have to recreate it.
Employee monitoring
For detailed monitoring and analysis of employee’s work you will need to switch from Quadrator by clicking on the employee cell. Program has 4 subsections for specific employee analysis and monitoring: programs, displays, violations, keylogger. Switch between subsections is carried out with "Tracker" section menu.
Online display view
When you switch from Quadrator, subsection "Monitors" opens by default. It shows activity on displays of the employee in online mode. If employee uses several displays, they will be displayed stacked.
Currently active display always appears first.
If the employee has paused data collection in the self-monitoring interface, or no video of that employee is being recorded, or the viewer is prohibited from viewing the video of that employee, the corresponding informer will be displayed instead of the video.
The section provides the ability to edit the name of the employee. To do that, double-click on the employee's name and change their first and last name in the dialog box.
Also in this subsection ticker bar with employee’s keypresses is realized in online mode.
If an employee doesn't have their keystrokes collected or if the viewer isn't allowed to view keystrokes, the running line with keystrokes of that employee will display informers like this:  or
or  .
.
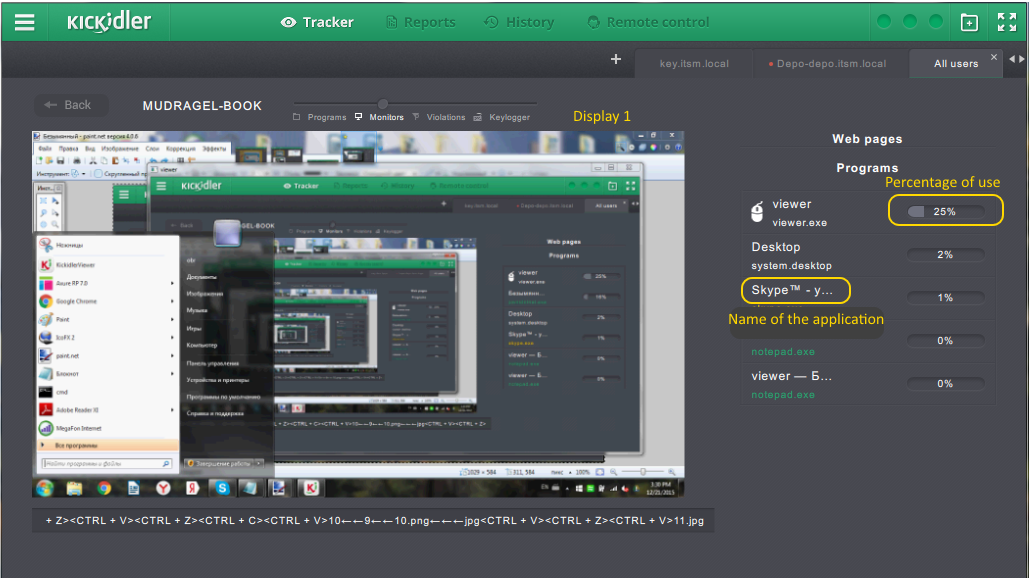
Running programs panel
Running programs panel for employee work analysis is placed to the right from video. Panel shows entries about currently active programs and web pages on the employee’s computer. There is a scale to the right from the application name that shows percentage of activity of the application in relation to the other application during the last 12 hours. If efficiency is set for a program or website, its name will be highlighted with corresponding color. This panel also has the following features:
- program or web page efficiency grade,
- switch to the application history.
To grade application efficiency, click on the icon ![]() and select appropriate grade. Click here for detailed information.
and select appropriate grade. Click here for detailed information.
Viewing history by application
To access the history by application, click on the icon ![]() . A window will open in which you need to select the viewing preferences: time frame and history viewing increments.
. A window will open in which you need to select the viewing preferences: time frame and history viewing increments.
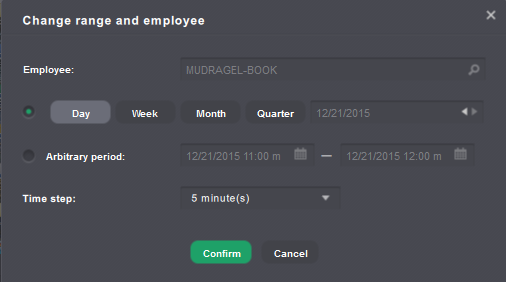
Once you have configured these parameters, click on the "Confirm" button.
Full-screen mode
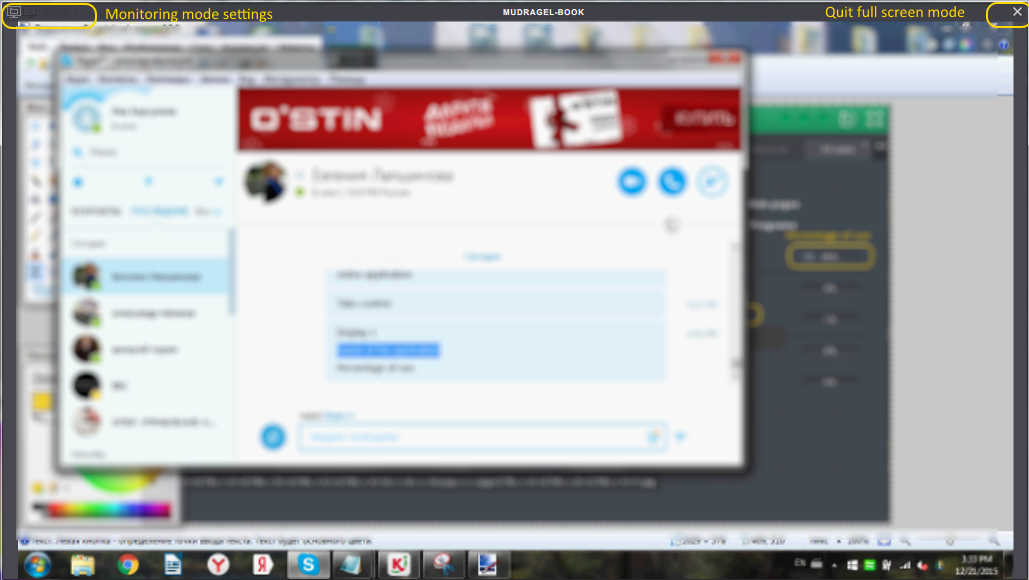
To switch to full-screen viewing of video from employee’s display, you need to click on the video area. Buttons for the view mode adjusting are the same as in Quadrator cell. Click on the screen area or on the cross in the top right corner to quit from full-screen mode.
Viewing of the running programs
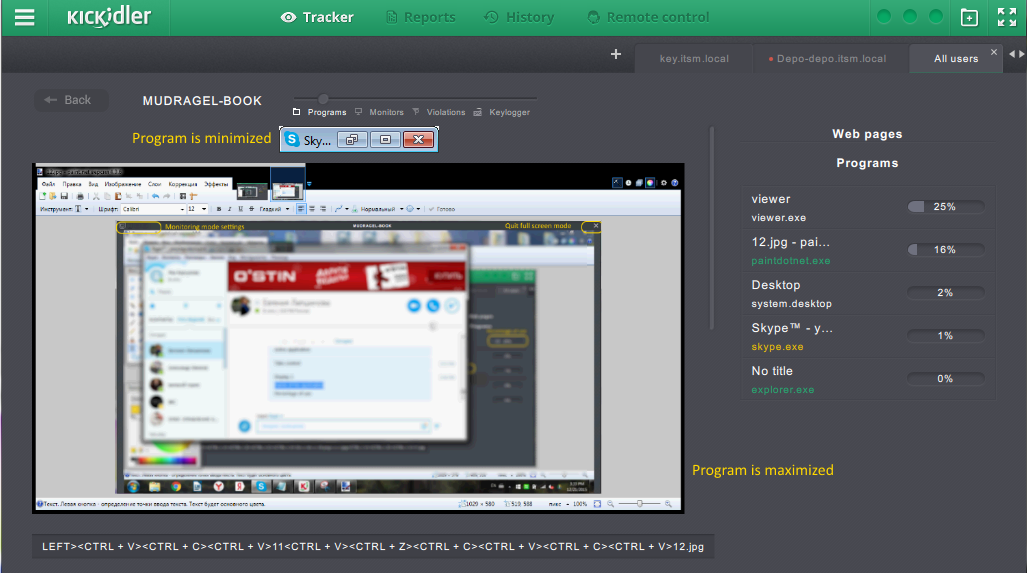
Click the button "Programs" to view the running programs. You will be transferred to monitoring section where all windows of the programs running on the employee’s computer are displayed. Windows can be maximized or minimized. You can view all programs by scrolling down. At the right there is panel with running programs, at the bottom - ticker bar with employee’s keypresses in online mode.
Click on the program view area to switch to full-screen view of selected program.
Employee work analysis
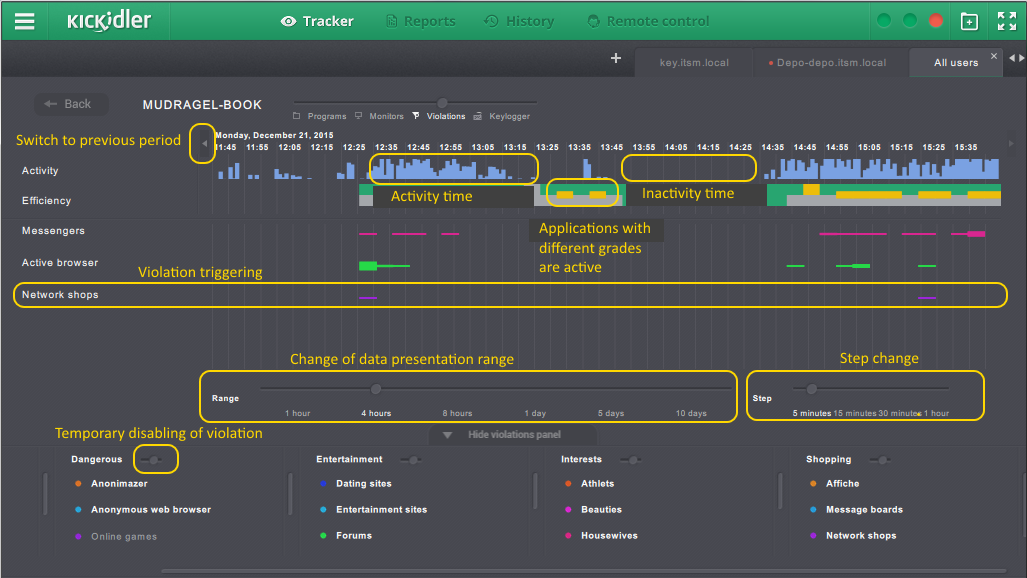
Click on the "Violations" button to browse to real time employee work analysis. All data regarding activity, efficiency and violations triggering during current period appears here.
Employee activity is displayed as histogram that changes according to employee activity through time. Time when employee was not active does not show on histogram.
There is a scale to grade employee efficiency. Scale has colors which reflect applications the employee worked with for a certain period of time. The time interval corresponds to the step in the settings. In the same time period employee can use applications with different grades. In such case scale division will be painted in different colors.
Violation triggering takes place if employee commits an event described in violation. The information about violation triggering appears on the screen area under efficiency scale. After triggering, entry with violation name appears at left and histogram is plotted in graphical area. Color of the histogram corresponds to the marker color set for that violation. Width of the histogram division depends upon violation intensity during time period. Intensity of violation during time period is expressed in percents. You can view the percentage of violation triggering by hovering the cursor over targeted plot segment.
The number shows the percentage of specified time interval when employee committed the violation.
You can watch the video of the period of time that interests you, for example, the moment of violation triggering. In order to do this, select segment in violation area or efficiency scale with mouse. The window will appear where you can switch to “History” section to view the video.
Selecting parameters for the analysis
Interface has special settings for more useful work with data. When you change the settings, plots will be rebuilt to reflect new parameters. There are following settings for the plots:
- analysis range select,
- analysis step select,
- violation list select.
Analysis range select
This parameter is adjusted on the scale under the area of violation triggering plots. The scale has six values: 1 hour, 4 hours, 8 hours, 1 day, 5 days, 10 days. 1 day is equal to 24 hours. Counting of the start of the selected range begins from the current time. Besides, there is a possibility to view the analysis results of the previous period of selected range. In order to do this, use the arrows placed on the top and on the sides of a time scale.
Analysis step select
When selecting a step, you set division size to divide the previously selected range. For each of the ranges fixed set of possible plot steps is specified. When you choose the smallest step information will be detailed as much as possible.
Violation list select
To hide or show violations in the chart, use the violations panel at the bottom of the screen. Use the "Show/Hide Violations Panel" button to display or hide the panel. The violations panel duplicates the Quadrator panel. The settings you set in Quadrator for a particular employee's cell are transferred to this interface and vice versa. To save configured violation settings for a Quadrator cell, you need to confirm such saving when you switch to another interface.
Activating a violation or a group of violations for an employee can be done in two ways:
- by clicking on the title,
- by dragging the caption to the chart.
Activated violations in the panel are highlighted white. You can activate both a single violation and a group of violations.
You deactivate the violation by clicking again on the title of that violation in the panel or by dragging its caption from the list of triggered violations to the violations panel. Such violations or groups of violations in the panel will become darkened. Charts are not generated for the deactivated violations, but all data is collected by the software to create reports or to analyze videos for specific time periods.
Analysis of keypresses
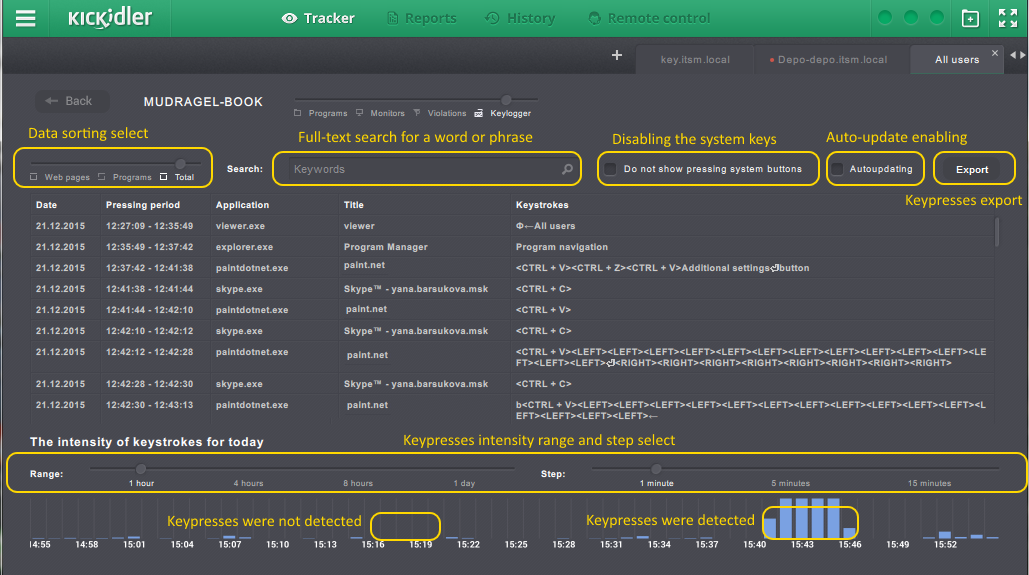
Click on the “Keylogger" button to browse to real time employee keypress summary. Data about keypresses of an employee for the current day is collected here.
Keypresses are bound with application and window title where they were triggered.
Also there keypress intensity plot is realized.
If an employee doesn't have their keystrokes collected, the section will display the following informer  , and keystrokes of that employee won't be shown from the moment when their collection has been disabled.
If the viewer isn't allowed to view keystrokes of said employee, the manipulation with the keystrokes in the section will be disabled and the export of keystrokes won't be available.
If the employee has Kickidler TimeTracker license assigned to the grabber, no keystrokes are collected by that grabber.
Sorting
By default keypresses from all programs and web pages are displayed. You can set filter “Web pages” or “Programs” for convenience. When you set the slider in “Programs” position, only keypresses from programs will be displayed. When you set the slider in “Web pages” position, only keypresses from web pages will be displayed.
Auto Update
Auto data update interval is set to 1 minute by default for the “Keylogger” subsection. You can switch off this feature for convenience. In order to do this, uncheck “Autoupdating”.
Display of system keypresses
All user keypresses are displayed by default. For ease of use, Keylogger has feature to hide system keypresses. In order to do this, check the box “Hide system keypresses” After that only digits and characters will be displayed which were not deleted with Backspace key.
Full-text Search
Full-text search feature is realized for quick data processing. To find any word or phrase, type it in the “Search” field. Program will sort data and will list only periods where the entered word or phrase occurred.
It should be noted that full-text search works not only for the keypresses but also for the “Application” and “Title” columns. That is, if you type “Skype” in the “Search” field, program will show only Skype conversations for the current day.
Keypress intensity plot
For easy monitoring of performing daily activities by employees there is realized display of the plot of the keypress intensity for the current day.
Plot will show keypress intensity for last hour by default.
Time interval can be adjusted (4 hours, 8 hours, 1 day) by slider.
You can change step of keypress intensity the same way.
Export
It is possible to export table of the keypresses in .csv and .xlsx formats.
To export table of the keypresses, click the “Export” button and select export file format in the window “Save keypresses”, folder where the file will be exported and name of the file.
All settings (sorting, displaying of the keypresses, full-text search) will be saved in export file.