 English
 Русский
 Português
 Español
 Հայերենով
 Türkçe
 Български
 中文
中文 ქართული
 Français
 日本語
日本語 Қазақ
Қазақ- Basic reports
- Working hours reports
- Working hours time sheet
- Day details
- Employee rating
- Report by application
- Notifications report
- Activity History
In the web interface of the Central Server you can generate all reports that have the program.
At the moment, the Central Server has the following types of reports:
- Basic reports.
- Working hours report.
- Timesheet report
- Day`s details
- Employee rating
- Report by applications
- Report on notifications
- Activity History
Basic reports
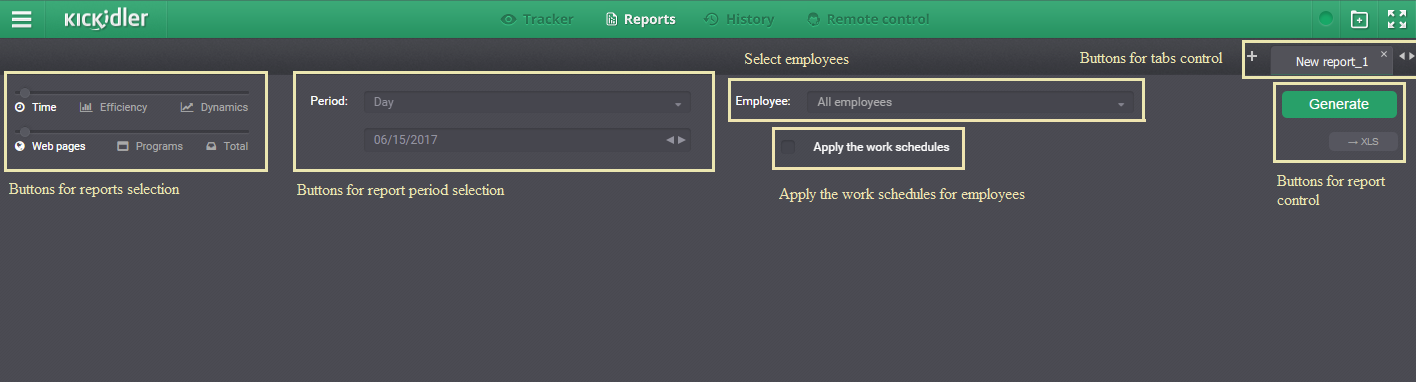
«Reports» section is used for the analysis of work of organization in whole. You can switch to the section by clicking on the «Reports» button in control panel. Report settings adjustment is made in the menu of this section.
You can create tabs in the section by clicking the “+” button. You will need just to type a name of the tab while creating it. After any parameter change you need to click “Generate” button. Generated report can be uploaded as XLS.
There are three types of reports:
- time report,
- efficiency report,
- dynamics report.
For any type of the report you need to select application category for the analysis:
- by web pages,
- by programs,
- total (both web pages and programs).
You can choose time interval from the offered most common variants or select the custom one. When you select custom interval you are able to specify the date and exact time for data analysis.
Fixed period by default starts from 00:00 of period specified. For example, when you generate report for the current week on Wednesday, data for the report will be analyzed from 00:00 of Monday of the current week. You can switch to the next period and back with arrow switches. For example, when you choose “Week” period for the current week will be set by default, but with arrow left you can switch to the previous week if you need to.
By default, all the time of employees is used in a given period. If you want to apply only time by work schedules set the checkbox "Apply the work schedules" and click "Generate".
If the part of data was not retrieved while generating report, program will warn you.
![]()
For the complete data retrieval refresh the report when all the servers of your company will be online (i.e. flash on with green color in the main menu).
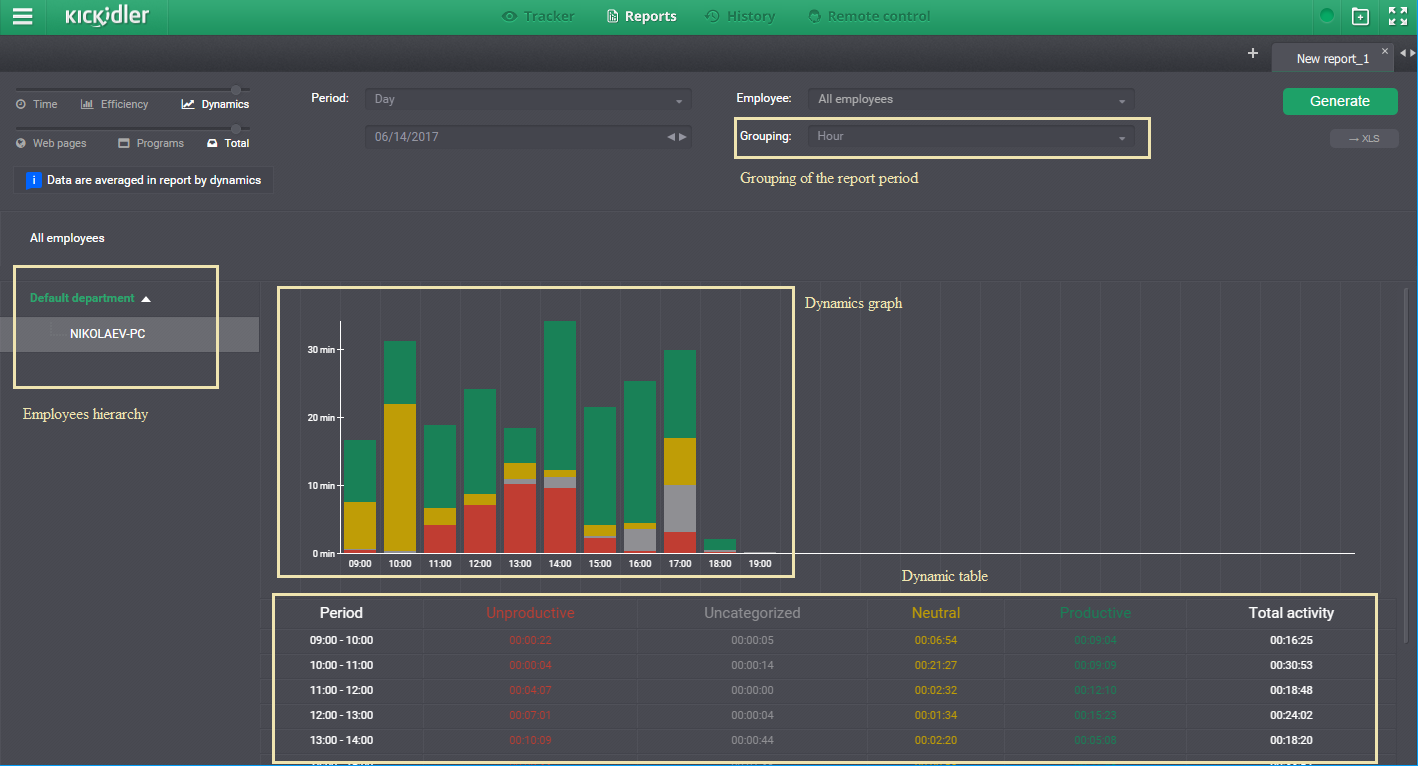
“Reports” section menu
“Reports” section menu consists of
- report display mode selection buttons:
- “Time” button — is used to select report based on applications usage time,
- “Efficiency” button — is used to select report based on applications efficiency,
- “Dynamics” button — is used to select report based on employees’ work dynamics.
- buttons to select applications category for the report:
- “Web pages” button — is used to select report based on web pages,
- “Programs” button — is used to select report based on programs,
- “Total” button — is used to select report based on web pages and programs.
- time period selection buttons:
- fixed period buttons (current day, week, month, quarter),
- “<” and “>” buttons to switch over fixed periods,
- custom period selection buttons (entering or selection of custom period from calendar).
- buttons to select grouping — only for the dynamics report:
- buttons to select grouping of selected period (various for different periods).
- control buttons:
- button “Generate report”,
- button “Export report in Excel”.
Time report
In this report the information about time when employees work in applications will be displayed.
By default, all the time of employees is used in a given period. If you want to apply only time by work schedules set the checkbox "Apply the work schedules" and click "Generate".
Separate report is generated for each application category.
Information in report is displayed as histogram. Every histogram is divided into two parts:
- time of activity in application,
- idle time in application.
Each of the parts is filled with corresponding color. Besides, for every histogram the total time of work in application is counted. This time is a sum of activity time and idle time.
Separate summary histogram is built for the entire organization. Histogram has a legend, where time in “HH:MM:SS” format is displayed and percentage of this value in relation to the total time is calculated. For the entire organization’s histogram 5 most used programs or web pages are indicated.
For the separate application histograms total time of work in the application and percentage of use are displayed to the right from histogram. Percentage of use is estimated as ratio of the total time of application work to the total time of work of selected department or employee in organization.
Histogram explanation:
1. by default to the right from the histogram is displayed:
- total time of work in absolute terms,
- percentage of application use, estimated as part of the selected department/employee time.
2. if you hover cursor over the part of the histogram with the activity time, at the right will be displayed:
- time of application activity (color will match the activity time color on histogram),
- percentage of activity, estimated as ratio of the activity time in application to the total time of work in the application.
3. if you hover cursor over the part of the histogram with the idle time at the right will be displayed:
- idle time of application (color will match the idle time color on histogram),
- percentage of the idle time, estimated as ratio of the idle time in application to the total time of work in the application.
The application list in time report can be sorted in two ways:
- in alphabetical order,
- by frequency of use.
Sorting by the frequency of use takes account of the total time of application work.
Efficiency report
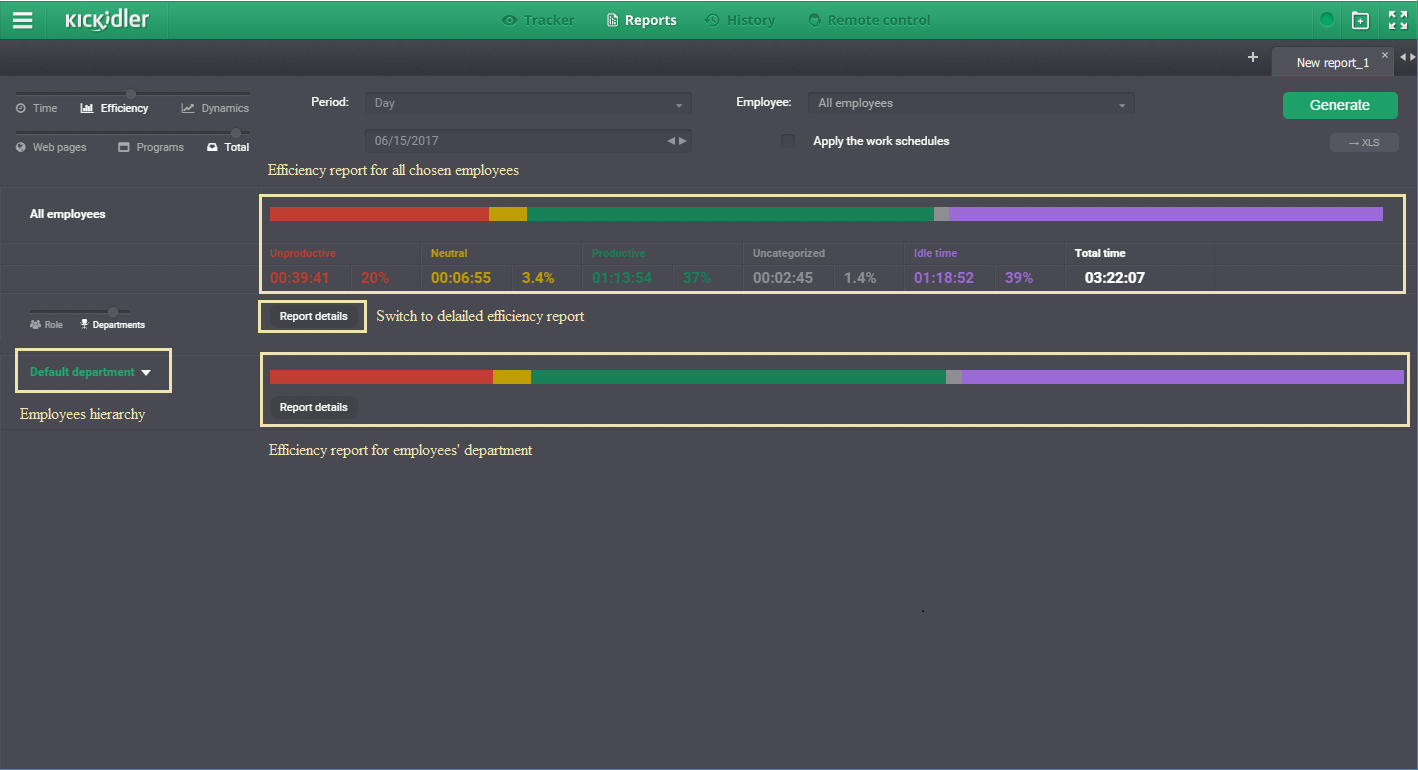
By default, all the time of employees is used in a given period. If you want to apply only time by work schedules set the checkbox "Apply the work schedules" and click "Generate".
This type of report shows analysis of employees work time with account of efficiency grades set for applications. Report is generated in form of histograms. Histogram can include five segments:
- unproductive - time of activity of the employees in applications, valued as non-efficient,
- neutral - time of activity of the employees in applications, valued as neutral,
- productive - time of activity of the employees in applications, valued as efficient,
- uncategorized - time of activity of the employees in applications that does not have a user grade,
- idle - time when user was not active in applications,
Segment presence and its size depend on corresponding time value. If the applications with grade “Unproductive” did not had activity time during specified period or in the specified department, segment “Unproductive” will not be appear on the histogram.
Histogram size is estimated proportionally to a total time displayed by this histogram. Maximal value among equal by report level is counted as one, histogram for that value will be built at whole screen width. Other histograms of that level will have less width proportionally to decrease in time of work.
Report histograms have step sorting by efficiency in the following manner:
- in descending order by values of activity time of the unproductive applications,
- in descending order by values of activity time of the neutral applications,
- in descending order by values of activity time of the productive applications,
- in descending order by values of activity time of the applications without grade.
Idle time has no effect at histogram sorting in the report.
Detailed efficiency report
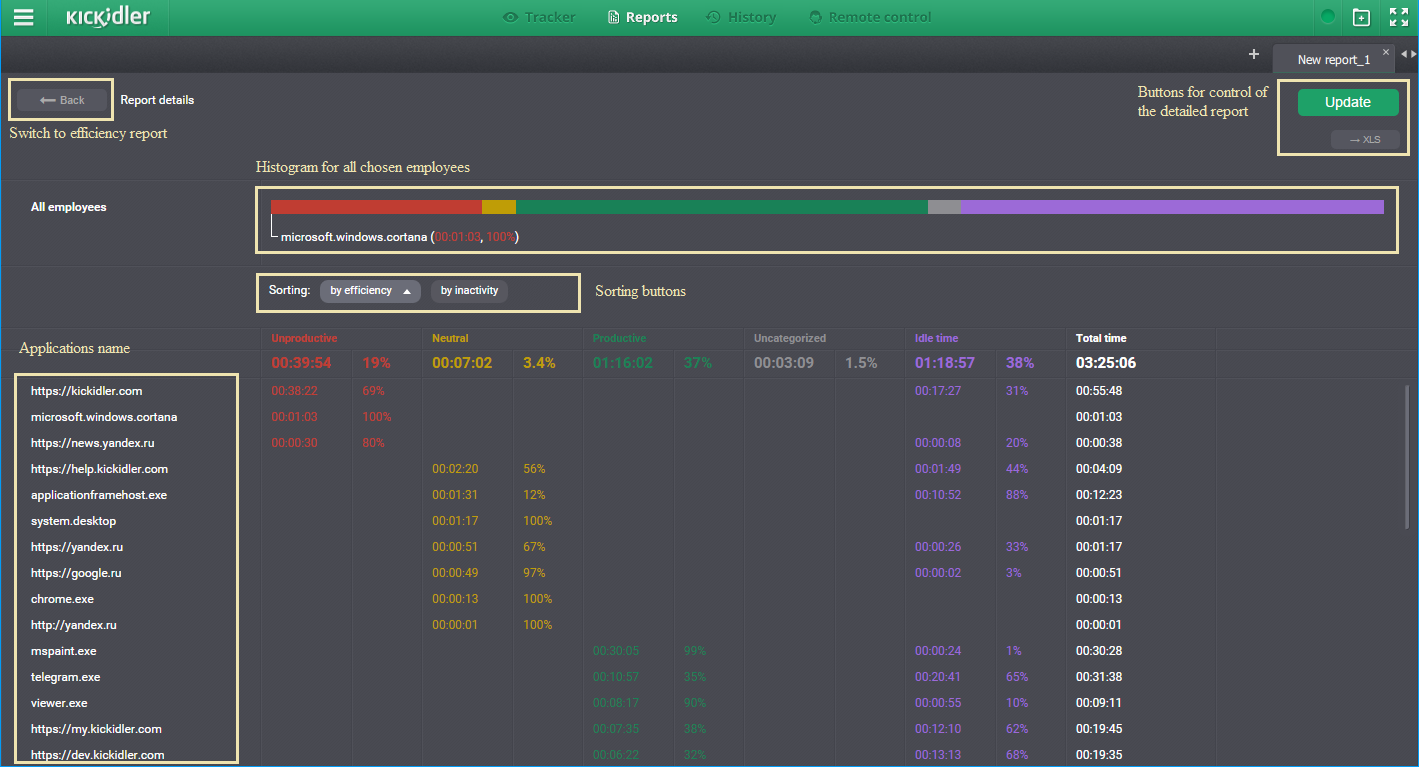
If you need to get detailed report about employees work in separate applications, click the “Report detailes” button. Detailed report has two types of sorting: by efficiency, by idle time. Sorting by efficiency is similar to sorting by the time report mentioned before. Sorting by idle time means that application list will be sorted out by idle time in application, in descended order. By default report has sorting by efficiency. You can select sorting type with corresponding buttons.
Dynamics report
This type of report shows dynamics of the employees work. Report is generated as dynamics plot and with detailization table below the plot.
To generate report, select item “Dynamics” in the control panel, type of the report (web pages, programs or both web pages and programs), report period and data grouping (the most convenient grouping for each of the selected periods is set by default). After selecting all of the necessary parameters click “Generate” button.
In the dynamics plot average data of employees activity is gathered in the following manner:
data about employees which were active during grouping period (grouping period is selected on the settings panel) is summarized and divided on the number of employees which were present at the work during that grouping period.
Note: if you have selected report period which belongs to several grouping periods (for example, period: 01/01/2014 - 01/05/2015, grouping: month), than grouping period will be averaged, i.e. activity data will be divided not only on number of employees present in the workplace, but also on number of grouping periods (for this example: for the January the data from Jan 2014 and Jan 2015 will be collected.)
Employee activity data on the plot and in the table are divided by efficiency categories:
- unproductive - time of activity of the employees in applications, valued as non-efficient,
- neutral - time of activity of the employees in applications, valued as neutral,
- productive - time of activity of the employees in applications, valued as efficient,
- uncategorized - time of activity of the employees in applications that does not have a user grade yet.
By default dynamics report is built for the entire company. If it is necessary you can select particular department or employee by clicking on it with left mouse button in organization structure located to the right from the dynamics plot. After that the report for selected department or employee will be generated.
After hovering cursor over the plot columns following pop-ups appear:
- about average time for every time interval – is displayed always,
- about number of employees which were active at work, present at work and about total number of employees in company (department, subdivision) – is displayed only for the entire company or for the departments.
Working hours reports
Working hours reports show information on the start and the end of a working day and any deviations from the employees work schedule.
To access working hours reports, open the side menu, switch to the “Reports” section and choose the “Working hours reports” subsection.
Warning!
In order to properly calculate latencies, undertimes, absences, business trips and sick leaves, only calendar based working hours are used in the report.
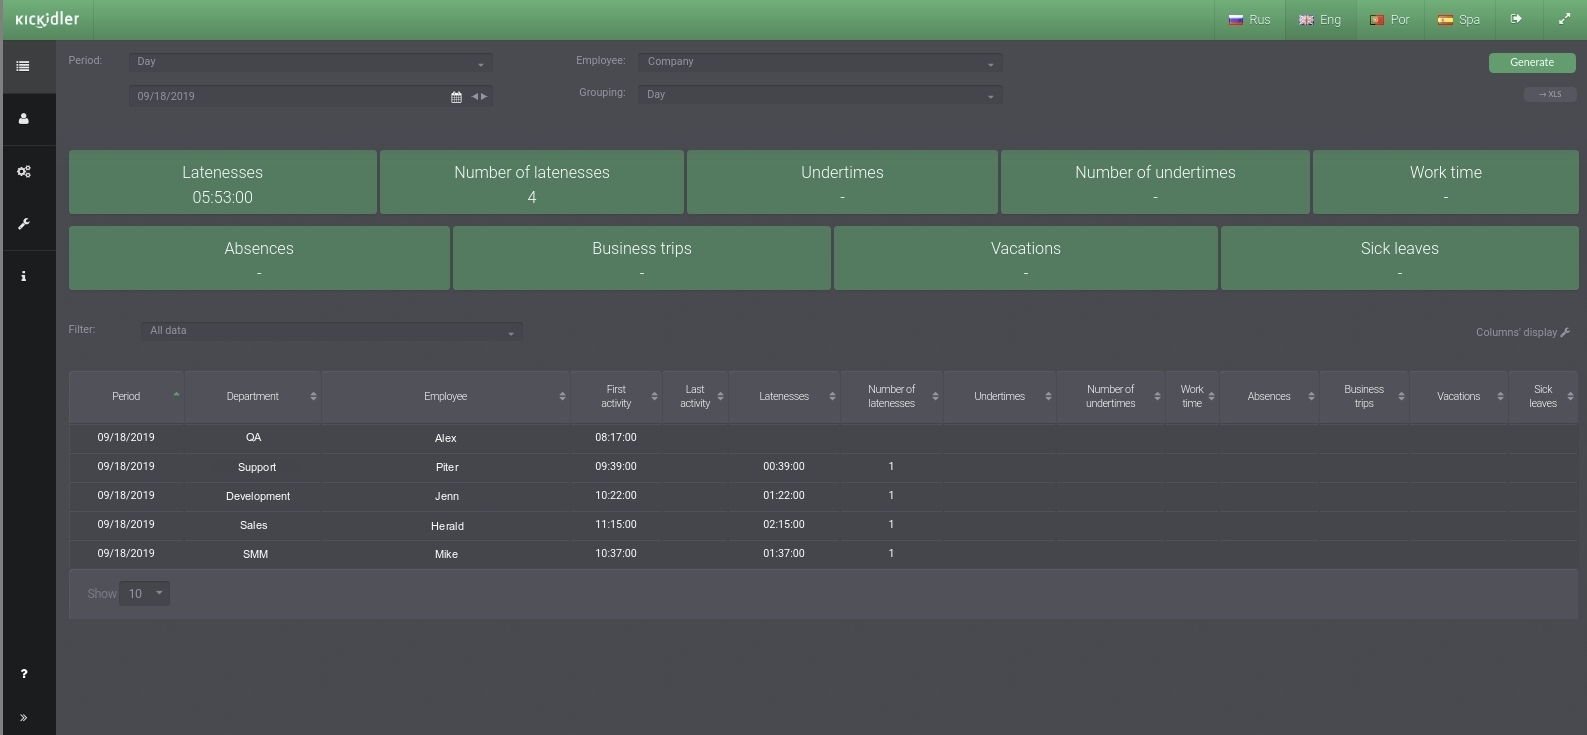
The following data is displayed In the table:
- Period – a time period from a report according to the chosen clustering
- Department – employee’s department
- Employee – employee’s name
- First activity – the time when an employee’s first PC activity had been registered
- Last activity – the time when an employee’s last PC activity had been registered
- Latenesses – overall employee schedule lateness time
- Number of latenesses – number of latenesses for the period in a chart row
- Undertimes – overall employee undertime
- Number of undertimes – overall employee undertimes number for the period in a chart row
- Work time – the time an employee has been at work from the first till the last activity
- Absences – overall employee absences amount
- Business trips – business trips amount for the period in a chart row
- Vacations – vacations amount for the period in a chart row
- Sick leaves – sick leaves amount for the period in a chart row
Within every row, there is the ability to apply descending and ascending data filtering. To filter data in any chart row, click its title.
Within the chart, there is the ability to apply undertimes and latenesses data filtering. To filter data by undertimes and latenesses, choose “Latenesses” or “Undertimes” filtering.
The web-interface is equipped with the ability to control the displayed rows. To change the set of displayed rows, click the “Columns` display” button and choose the row you need to hide.
When changing any value, click the “Compose” button. A composed report can be saved as an XLS file.
Working hours time sheet
The “Working hours time sheet” shows information on employees’ working hours, absences, business trips, vacations and sick leaves during the chosen period.
To open working hours time sheet, go to the side menu, open the “Reports” chapter and click the “Working hours time sheet” subchapter.
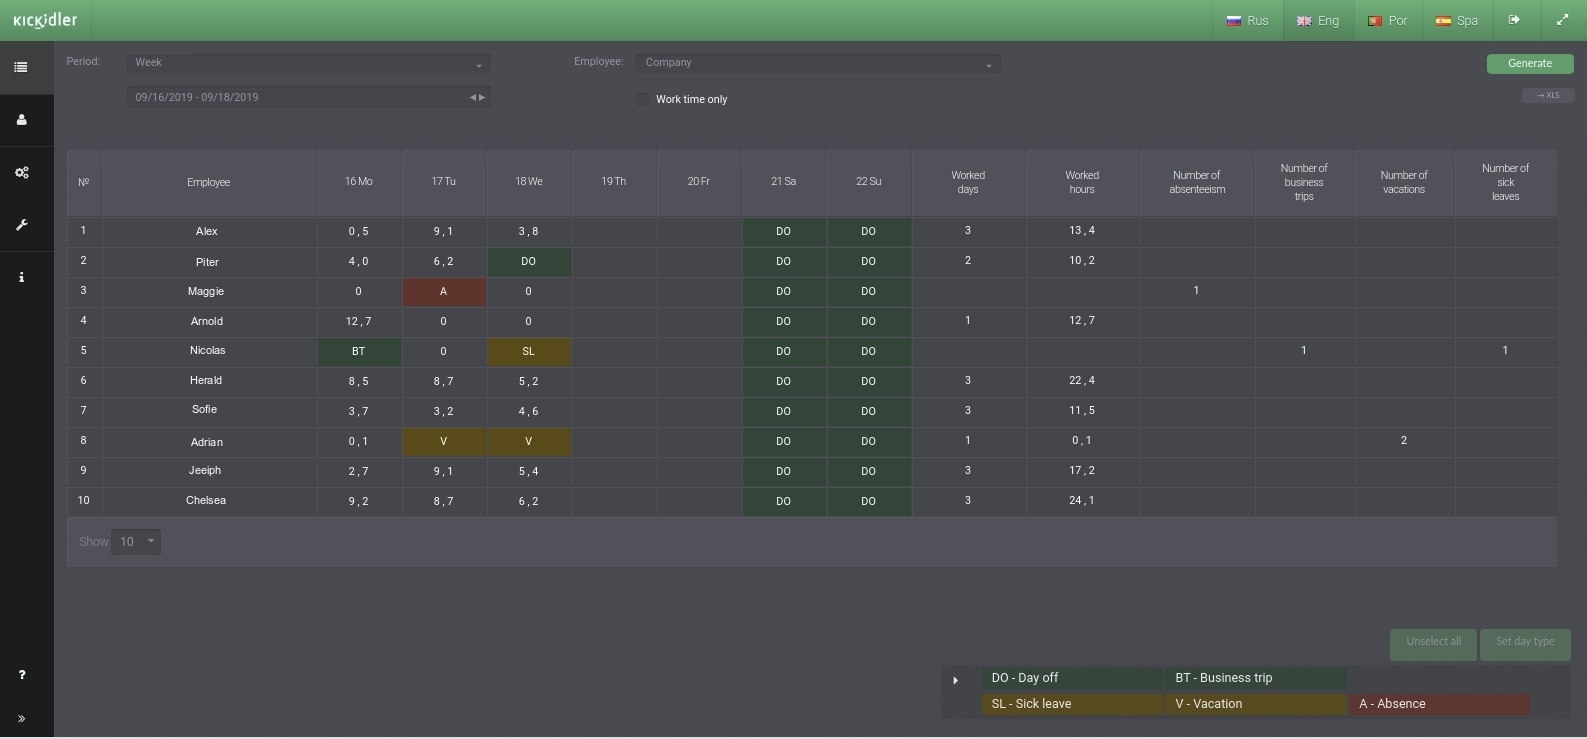
The report may include data for a weekly or monthly data.
There’s the ability to change day value in an employee’s calendar. To change the value, choose the required day in a time sheet and press the “Set day type” button. After applying changes, the report will be automatically generated according to the changes made.
When changing any report parameter, click the “Compose” button. A composed report can be saved as an XLS file.
Day details
The “Day details” report shows the information on an employee’s daily activity.
To open day details report, go to the side menu, open the “Reports” chapter and click the “Day details” subchapter.
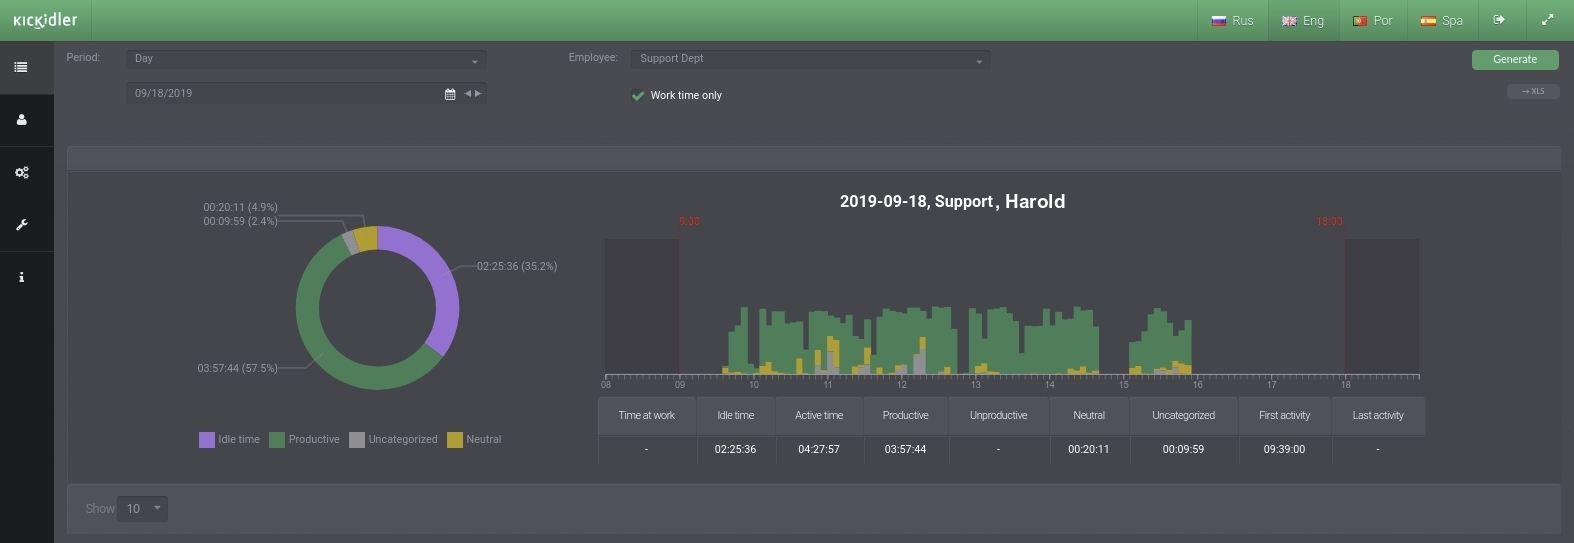
The report may include data for a weekly, monthly or quarterly data.
The report shows the information on daily activity allocation as a pie chart, a dynamics chart and a detailed chart.
A pie chart shows how long an employee has been using productive, semi-productive and non-productive applications, as well as applications with no category, and how long he has been idle.
Pressing on the pie chart will allow you go to the “Report by application”. This will allow you to get information about the the list of used applications of this category for that day.
The dynamics chart shows the employee’s activity structured by effectiveness categories. In addition, the dynamics chart shows areas out of working schedule.
The detailed chart provides a consolidated information on an employee’s working day, including the time of the first and the last PC activity.
When changing any report parameter, click the “Compose” button. A composed report can be saved as an XLS file.
Employee rating
The “Employee rating” report is designed to display employees’ rating on different types of activity – productive, unproductive, neutral and inactivity.
To go to the “Employee rating” report, open the side menu, open the “Reports” section and choose the “Employee rating” subsection.
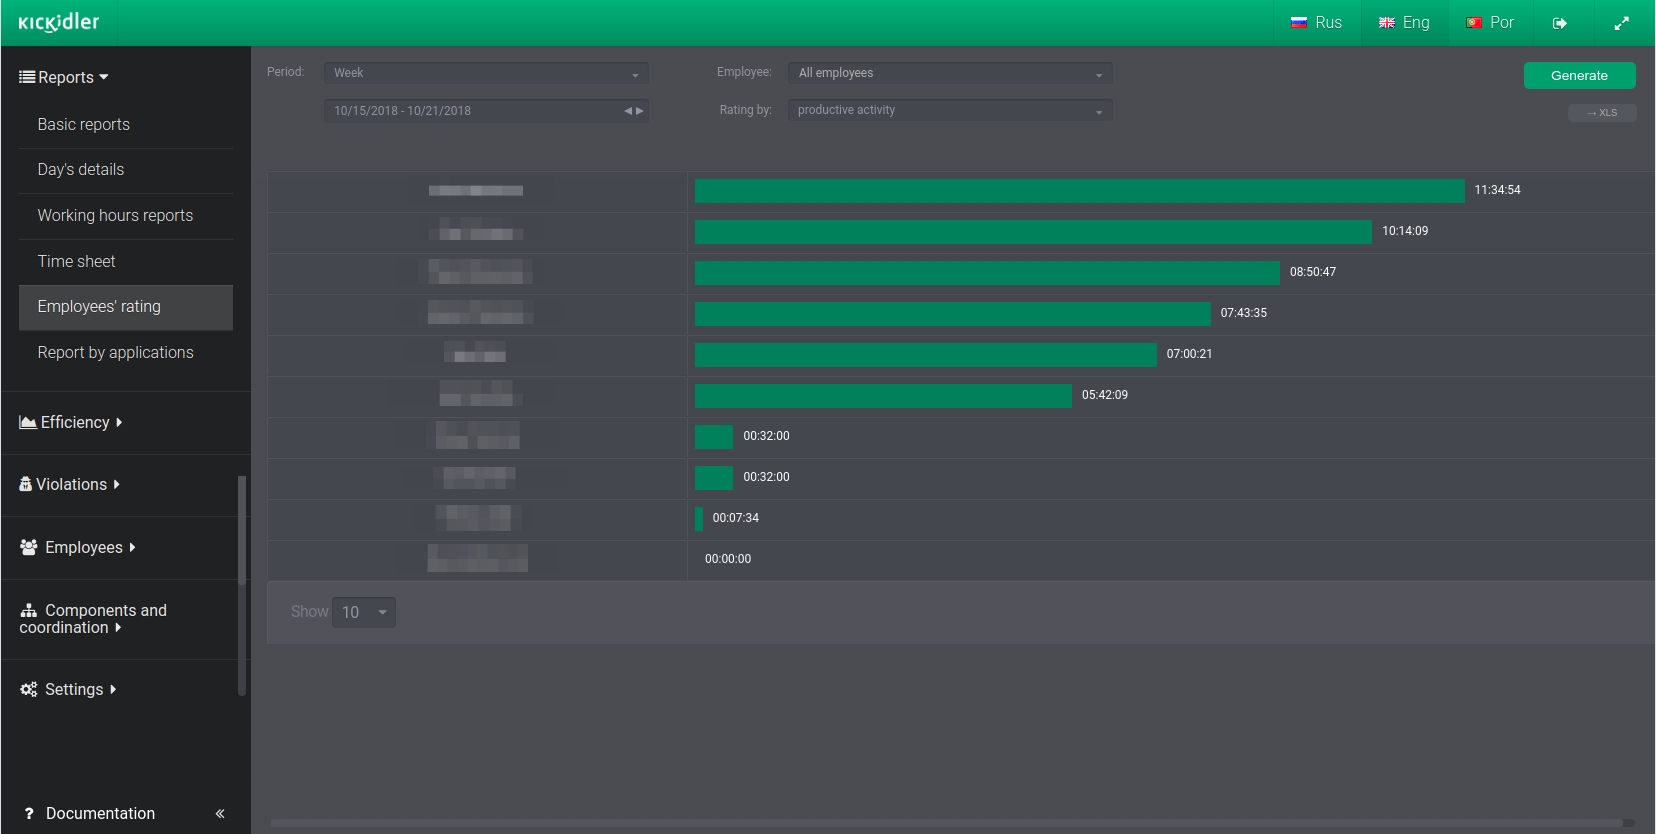
Information on time of activity of the set type or inaction time on each employee in decreasing order of time of activity or inactivity is provided in the report.
The information about the amount of time that an employee has spent doing specified type of activity or inactivity is provided in the charts.
If you change any parameter, you need to press the “Generate” button. The created report can be uploaded in the XLS format.
Report by application
The “Report by applications” report is designed to display the list of the used applications for the specified period of time.
To go to the “Report by applications” report, open the side menu, open the “Reports” section and choose the “Report by applications” subsection.
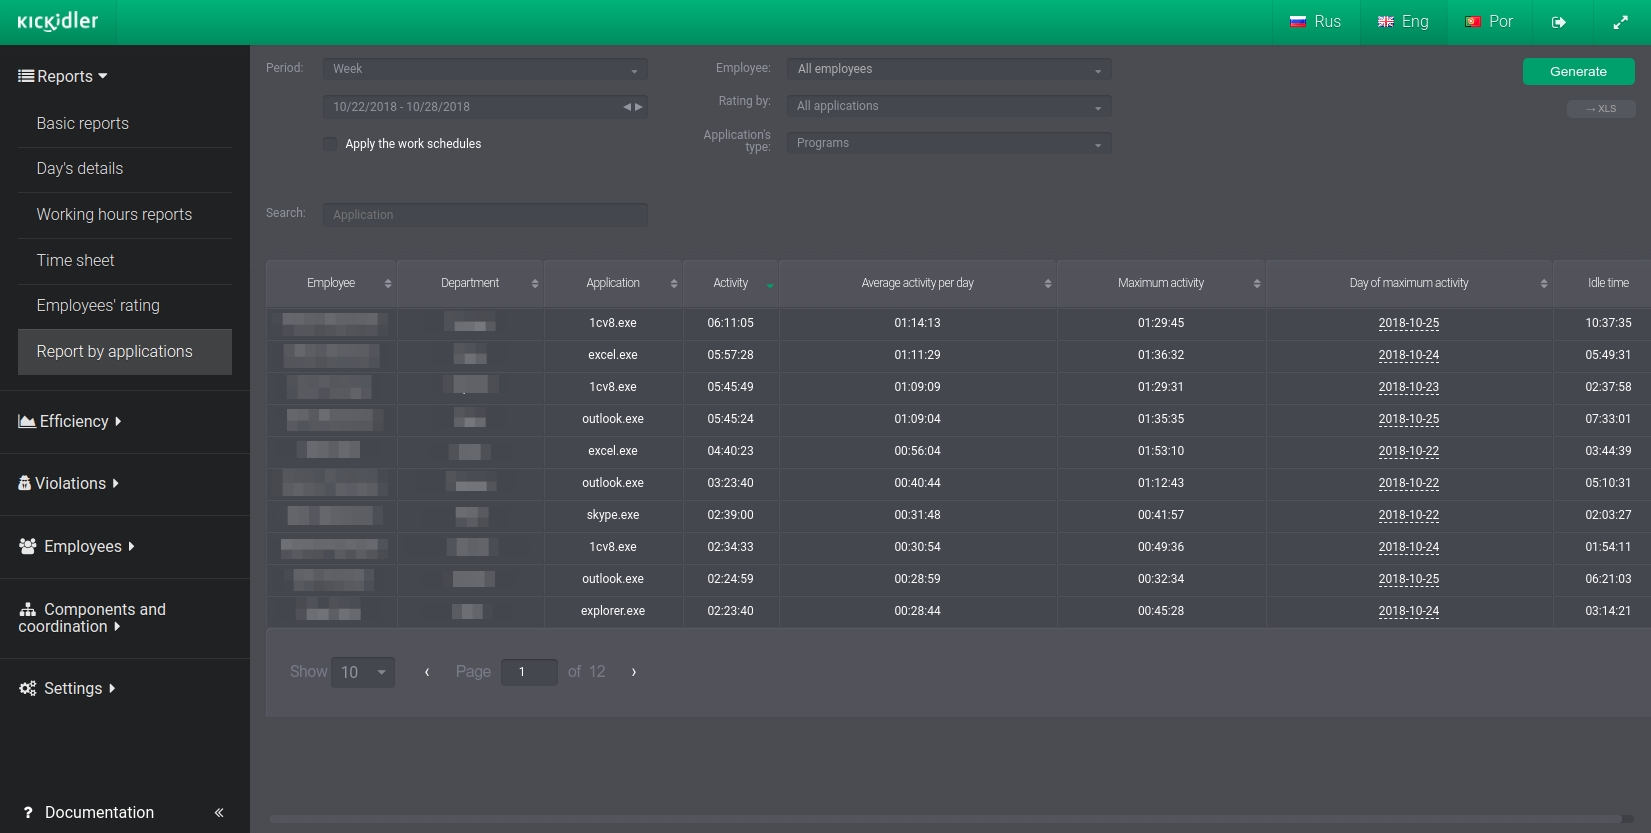
The following data is displayed In the table:
- Employee – the name of the employee,
- Department – the department of the employee,
- Application – the name of the used application,
- Activity – total time of activity for the chosen period,
- Average activity per day – the average time which has been spent in the application in the day for the specified period of time,
- Maximum activity – time of the maximum activity in the application for the period,
- Day of the maximum activity – date when the maximum activity for the period has been recorded,
- Idle time – total time of inaction for the chosen period of time.
For each column the functionality of data sorting in descending and ascending order is implemented. To sort data in any column of the table, press the title of that column.
In the report the search on applications is also implemented, which allows you to identify all the employees who used that application for the specified period of time.
Pressing date in the “Day of the Maximum Activity” column will allow you to go to the “Details of the day” report.
If you change any parameter, you need to press the “Generate” button. The created report can be uploaded in the XLS format.
Notifications report
Report on notifications is aimed at displaying information on automatic notifications that are assigned to employees.
To view the report on notifications, open the sidebar menu, open "Reports" section and select the "Notifications report" subsection.
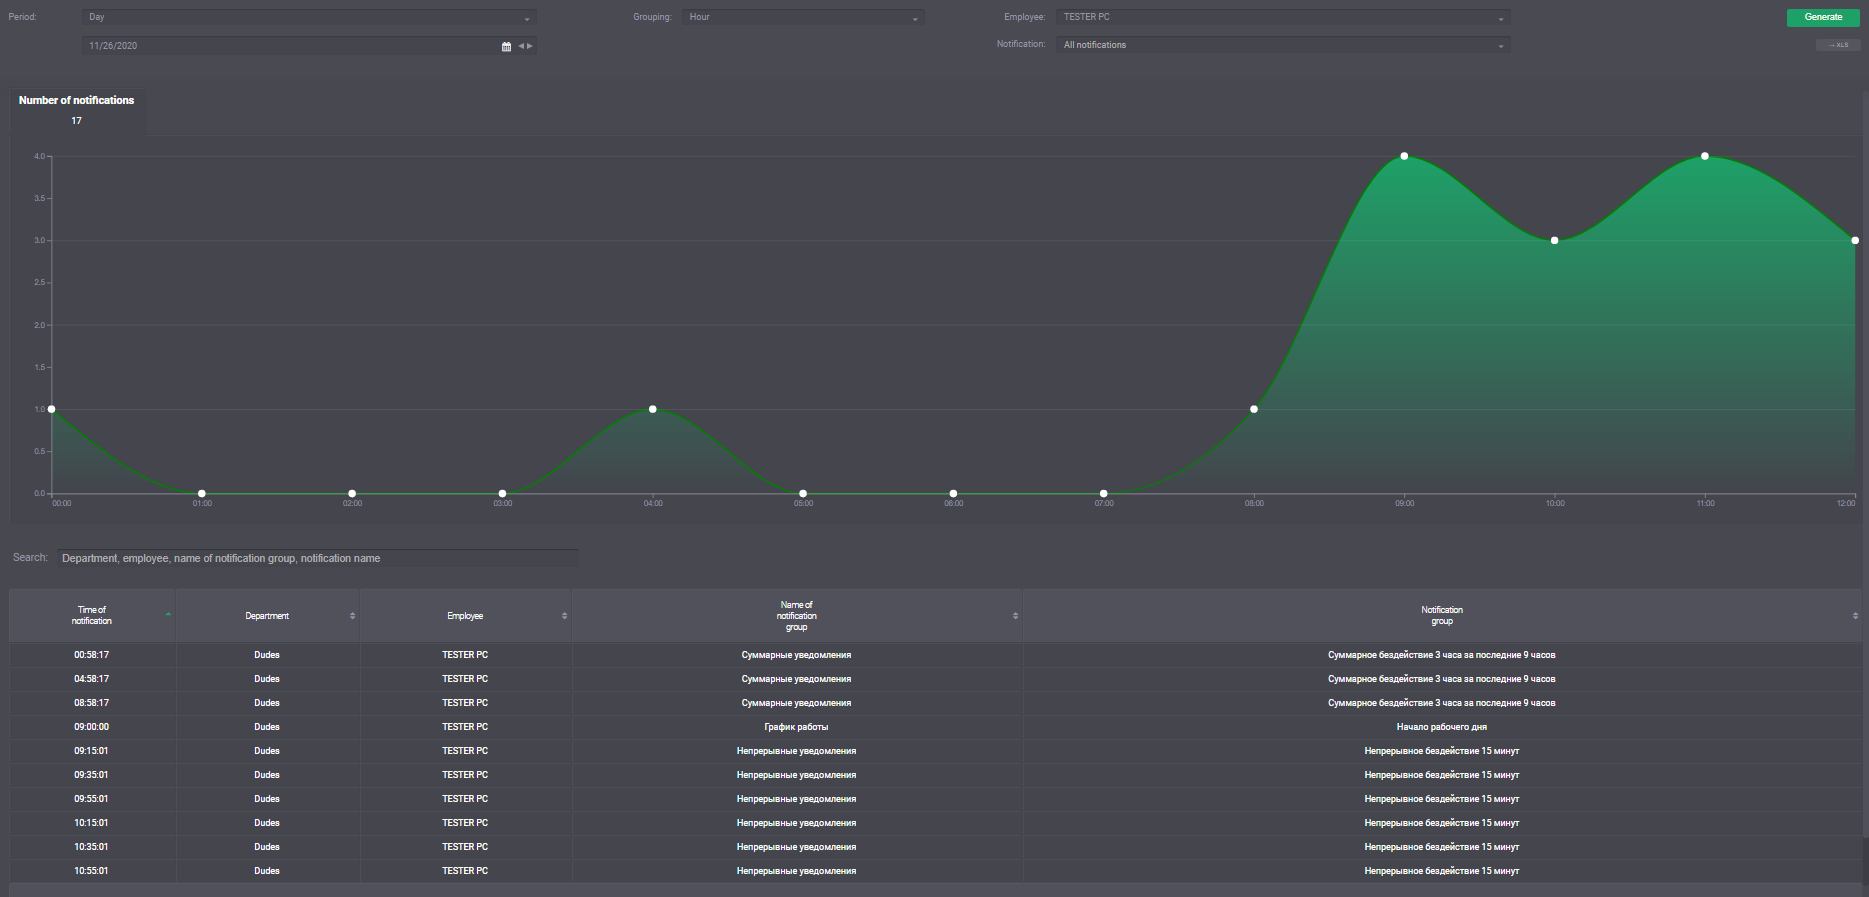
The report contains a chart of notifications and a table with detailed information regarding the notifications.
The chart displays information about the number of notifications for each chosen time period. If you point your mouse to a certain point on the chart, you can see the number of triggered notifications at the selected period of time.
You can see the details of the notifications in the table, specifically:
- Time of the notification - the moment of time when the notification was triggered,
- Division - name of the division the employee is in,
- Employee - name of the employee that triggered the notification,
- Name of the notification group,
- Name of the notification.
Attention! The table has a limit on the number of records. The table will not be created if there are more than 1000 records in it.
To review the table, customize the period, employees and notifications settings and then click the "Generate" button.
You can upload the report in XLS format to view the available data.
For each column of the table, you can sort the data in descending and ascending order. To sort the data by any column of the table, click on the header of that column.
An additional filter search has been implemented for the table. The search allows you to identify all employees who have triggered specific notification.
If you change any of the report parameters, click the "Form" button. The generated report may be uploaded in XLS format.
Activity History
The “Activity History” report is designed to review an employee's workday without having to resort to viewing a full-length video.
To access the report, open the side menu, click the “Reports” section, and select the “Activity History” subsection.
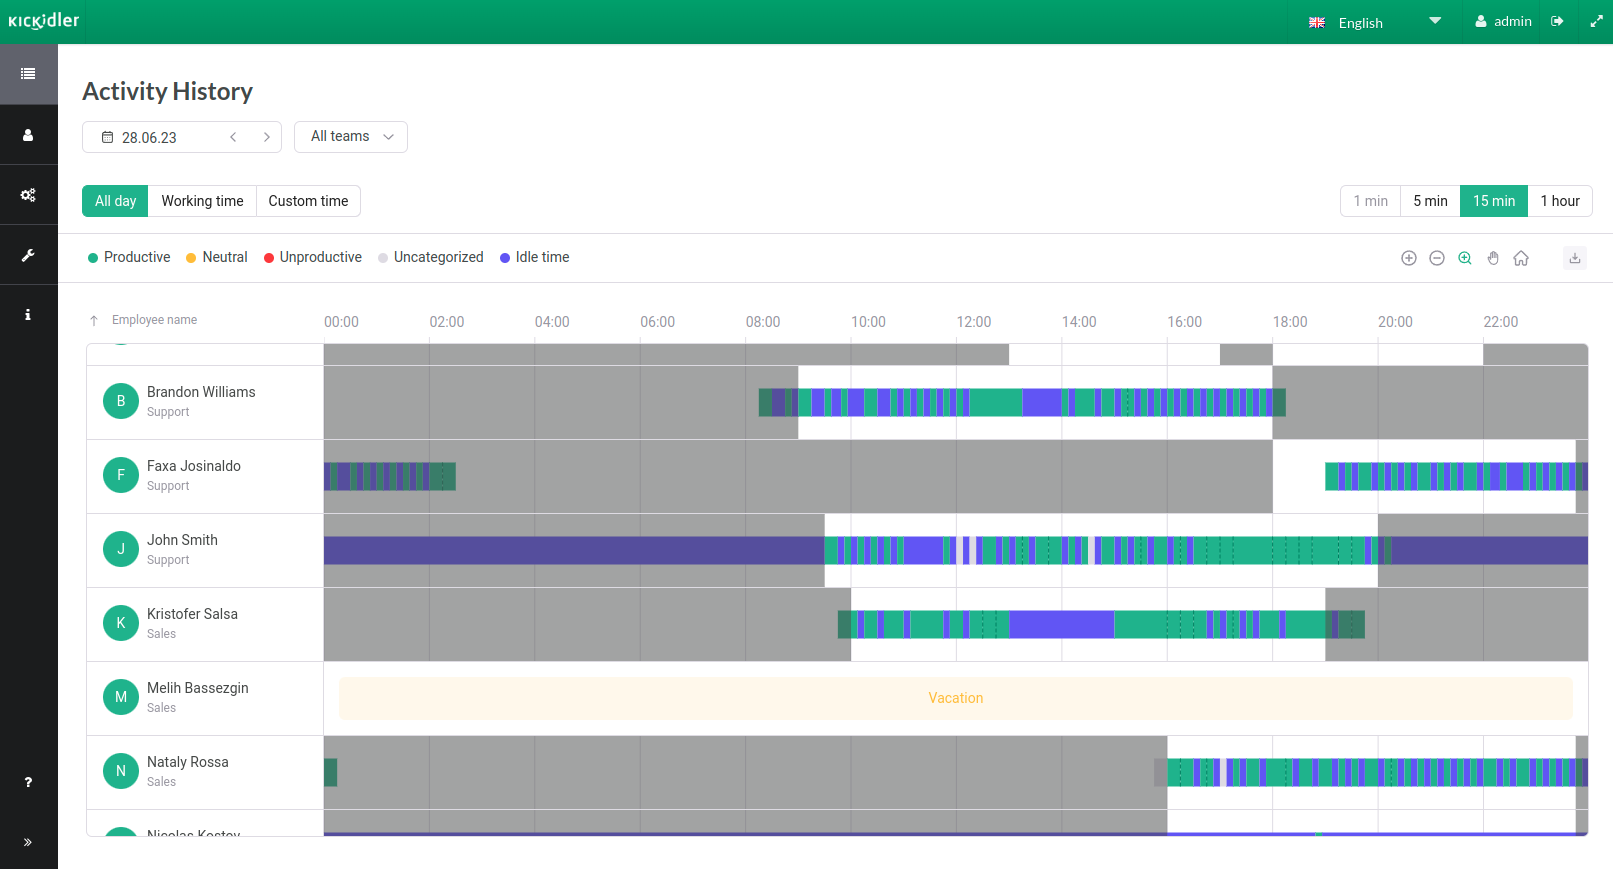
The report consists of several levels: upper layer of the report and the detailed layer of the report.
The upper layer of the report allows you to study the work of the entire company or its divisions, as well as identify employees whose workday should be examined more thoroughly.
The detailed layer of the report allows you to examine the workday of each individual employee in detail.
Upper layer of the report
The report is generated automatically for each day for the entire company. If necessary, the day and employees for whom the report is to be generated can be changed.
To work with the specific time range within a single day, the following time filters are available: “All day / Working time / Custom time” When you click on these filters, the data for the report will be loaded for the specified period.
The time period for the report is divided into equal periods of 1, 5, 15 minutes or 1 hour – these periods are called granules, and they allow you to view a large time range with convenient detailing. To switch the size of the granules, there are buttons of the same name that help to divide the day into larger or smaller parts.
There is an option to change the viewed scope for the upper layer, namely: zoom in and zoom out, highlight the zone of interest, scroll horizontally, and return to the original scale. A panel with corresponding buttons is implemented for this purpose ![]() .
.
When there is a change of scale, the best granule size for that scale is automatically selected.
The upper layer of the report consists of a graph and a context menu.
Graph
The graph displays information for each employee for the selected day. For each employee, the software generates its own graph on the timeline, filling it with granules of activity and inactivity according to the settings.
The granules on the graph are colored as activity or inactivity, according to the efficiency assessments for each application and website:
- If mainly productive apps and sites were used within the granule, it will be colored as productive activity. If mainly neutral, unproductive or uncategorized apps and sites were used, it will be colored in accordance with the corresponding activity.
- If the most frequently used application or website of the same category varied in adjacent granules, the granules will be separated by a dotted line (for example, if the employee first used Word, which is considered a productive tool, then switched to Excel, which is also assessed as a productive tool, then a dotted line will appear between the granules). If the most frequently used application or website of the same category did not vary in adjacent granules, then there will be no separation between them (for example, the employee used Word for a long time with no breaks).
- If there was no activity, but the computer remained turned on, the granule will be colored as inactive (for example, the computer was not turned off when the employee left for the night or at the time of their lunch break).
Context menu
You can click on the granules on the graph to open a context menu.
The context menu provides information about the employee, the granule range and the most frequently used applications for that granule.
The software includes an option to examine the employee's workday in detail. To do this, you need to press the button in the context menu to go to the detailed layer of the report.
Detailed layer of the report
The detailed layer of the report allows you to study the work of one employee in detail. For this purpose two modes are implemented:
- Summary view
- Detailed view
By default, the report is displayed in a summary view, which includes a table divided into equal time intervals, granules. If necessary, you can change the size of the granule.
The summary view table provides the following information:
- Granule size,
- List of running applications and visited websites that were used during the specified time interval,
- List of headers that were used in the specified apps or sites,
- Total amount of activity and inactivity time for apps, sites and their headers.
If necessary, you can search the app, site or heading in the summary view table.
When you switch to the detailed view of the report, the table changes significantly. In this case, the software offers the complete picture of the day, where apps and sites visited by the employee will be recorded by certain time intervals.
The detailed view table provides the following information:
- Time of using an application or visiting a website
- Duration of usage
- Application that was used
- Title of that application
If the browser was used, the table will include:
- Site visited
- Full URL of the resource visited on that site
You can also search the app, site or heading in the detailed view table, if necessary.